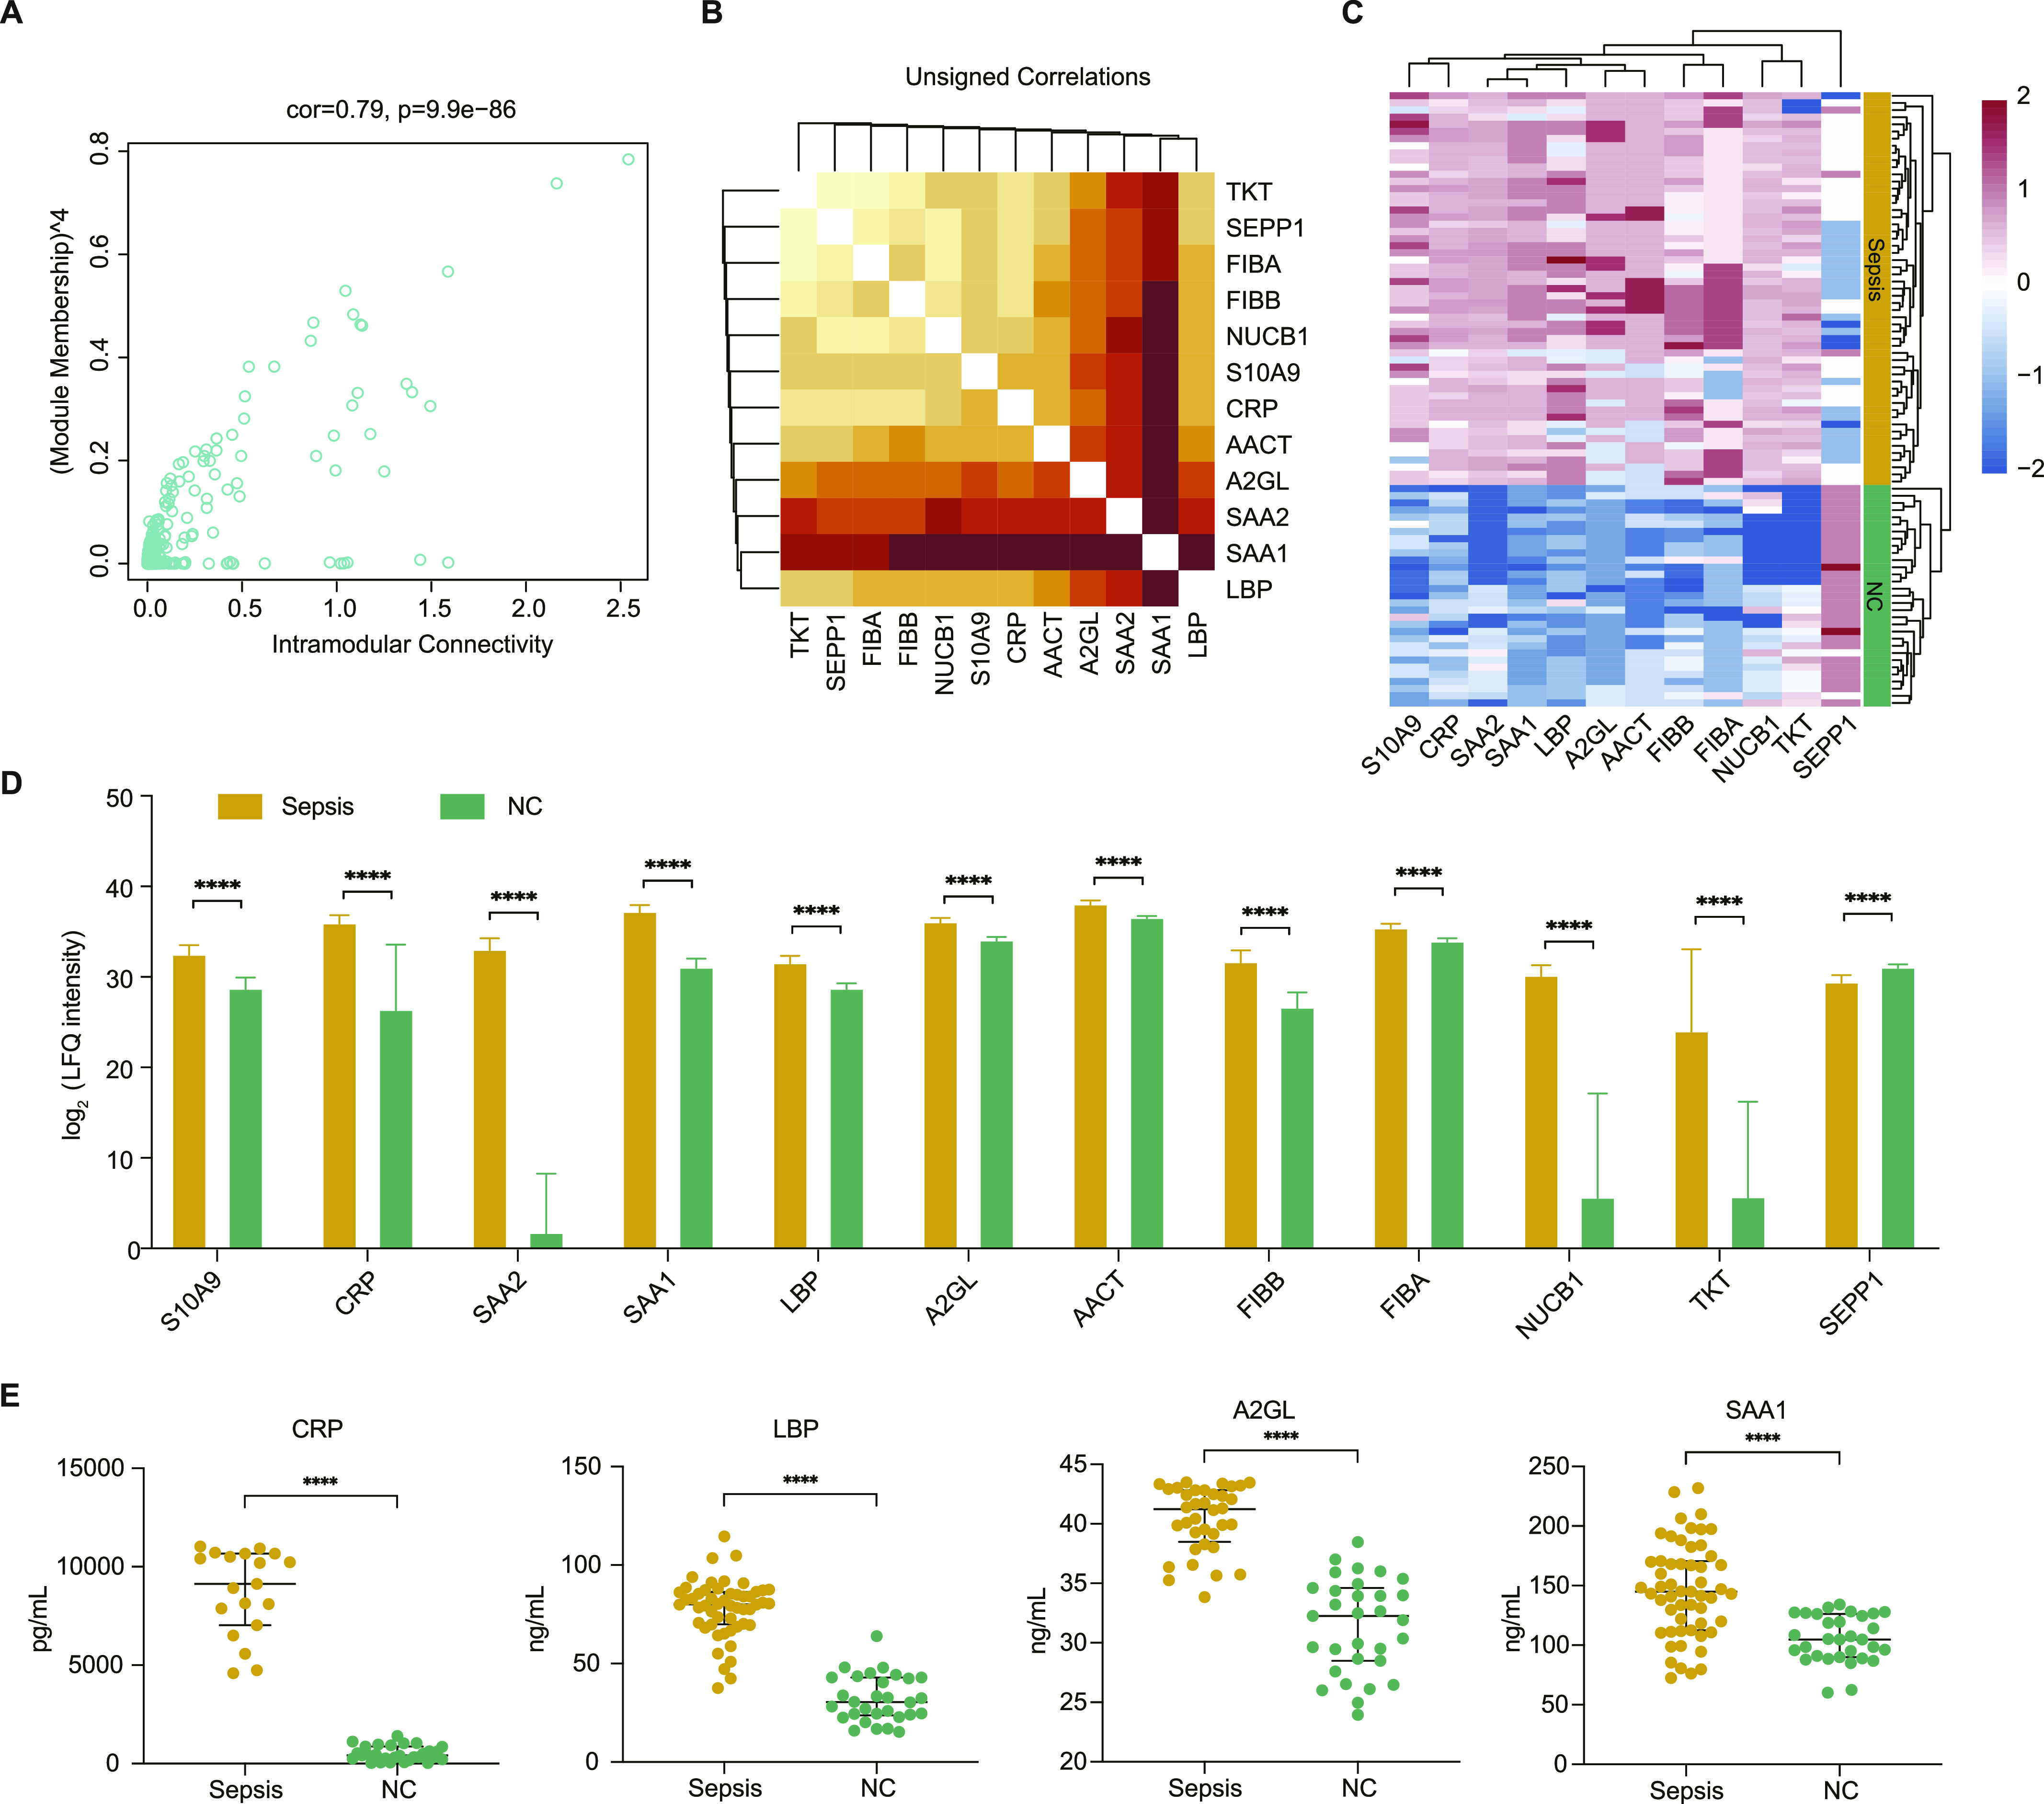
Figure 6. Sepsis-related potential biomarkers from the module highly correlated to sepsis.

(A) Scatter plot of module eigenproteins in the turquoise module. (B) Heat map representation depicting the topological overlap matrix among the 12 hub proteins. Light colours represent low overlap, and progressively darker red represents higher overlap. (C) Unsupervised hierarchical cluster analysis of the abundance profile of the 12 hub proteins in patients with sepsis and healthy controls. Label-free quantification protein intensities were log2-transformed and normalized into Z-scores by rows. (D) The abundance of the 12 hub proteins in the derivation group. (E) ELISA-based validation of four randomly selected biomarkers of sepsis development. (D, E) Data information: In (D, E), data are presented as the mean ± SD or median with IQR ****P-value < 0.0001; ***P-value < 0.001; **P-value < 0.01; *P-value < 0.05 (Mann–Whitney U test).
