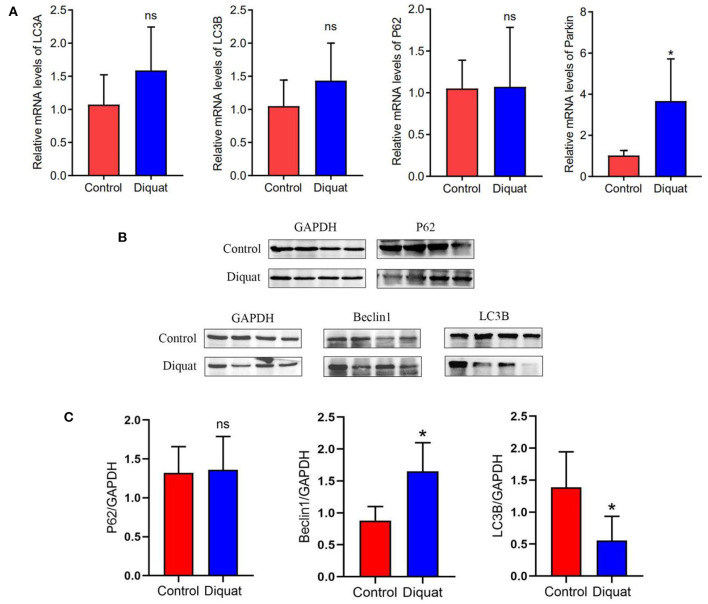
Figure 5.
The expression of autophagy genes and proteins in the liver. (A) Autophagy mRNA gene expression: LC3A, LC3B, and P62. (B) Western blot detects protein expression bands: P62, Beclin 1, and LC3B. (C) The level of the protein expression: P62, Beclin 1, and LC3B. “ns” and * indicates the level of the significance. (“ns” means no significant difference, *p < 0.05 compared to the control conditions).

