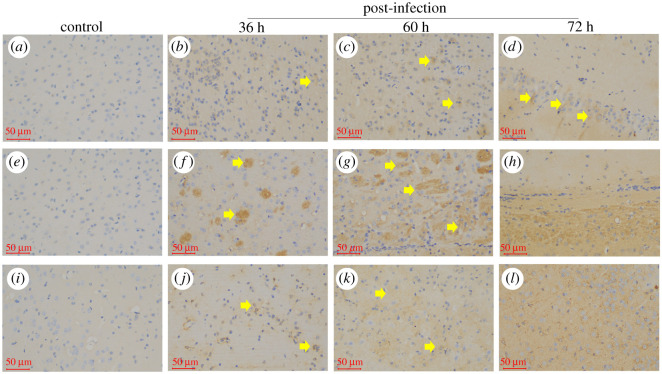
Figure 4.
The in situ expression of Caspase-1, IL-1β and IL-18 in the mice brains by HI. (a) Caspase-1 expression in the control group; (b–d) Caspase-1 expression in the brain at 36, 60 and 72 hpi; (e) IL-1β expression in the control group; (f–h) IL-1β expression in the brain at 36, 60 and 72 hpi; (i) IL-18 expression in the control group; (j–l) IL-18 expression in the brain at 36, 60 and 72 hpi; obvious positive regions could be seen in yellow in (h) and (j); positive regions are shown in yellow arrowheads in (b–d,f,g,j and k), scale bar = 50 µm.

