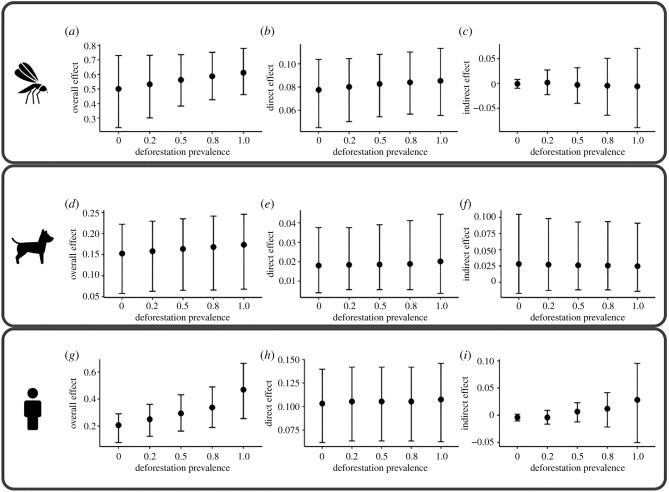
Figure 5.
Network causal effect estimates under different degrees of deforestation. Data are presented as the median (circle) and 95% credible intervals. Each panel shows the overall (left), direct (middle), and indirect (right) effects of different degrees of deforestation on the occurrence of the vector Lu. longipalpis (a–c), CVL (d–f), and HVL (g–i) in the network (São Paulo state).

