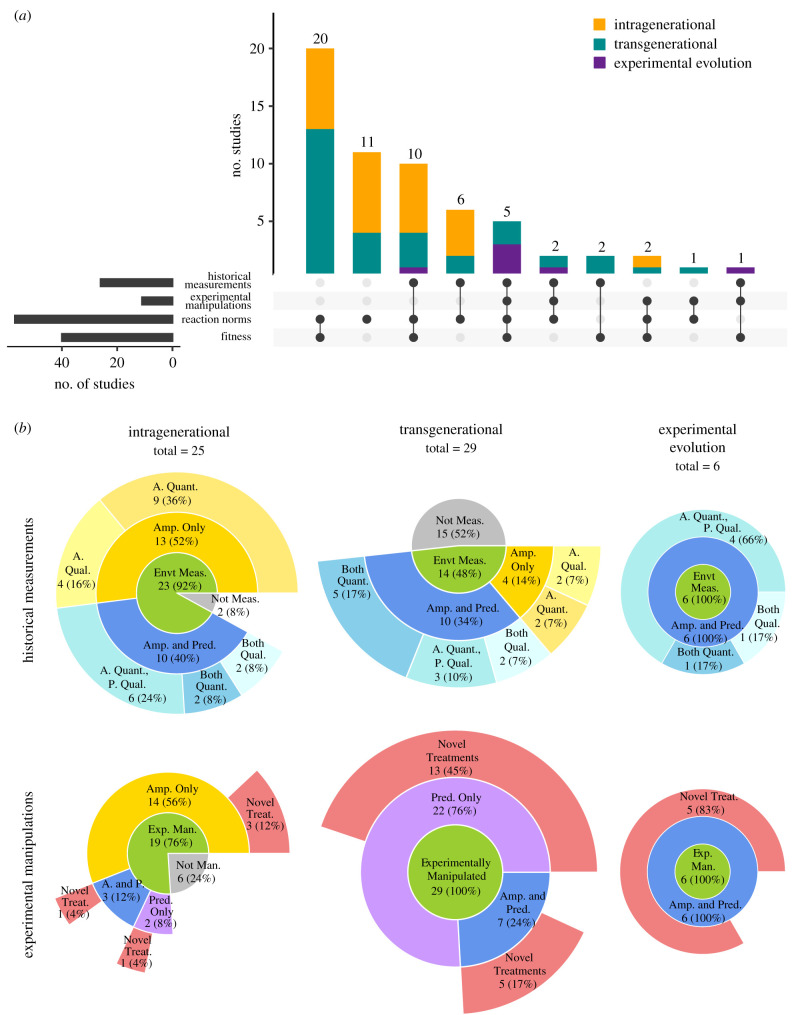
Figure 1.
(a) The number of empirical studies (intragenerational, transgenerational and experimental evolution approaches) included in our literature review, as well as which pertinent aspects of experimental design they incorporated. (b) Sunburst charts display the intragenerational (left column), transgenerational (centre column) and experimental evolution (right column) studies that were assessed to determine the proportion that measured, and in the case of experimental evolution studies, controlled, amplitude and/or predictability in the historical environment (top row) and that manipulated experimental levels of amplitude and/or predictability for comparative evaluations (bottom row). Studies that experimentally manipulated amplitude and/or predictability may have incorporated novel treatment(s). The number of studies within each chart category is displayed with its percentage of the total number of studies in parentheses. Abbreviations: Amp. = A = amplitude, Envt = environment, Man. = manipulated, Meas. = measured, Pred. = P = predictability, Qual. = qualified, Quant. = quantified, Treat. = treatment. (Online version in colour.)

