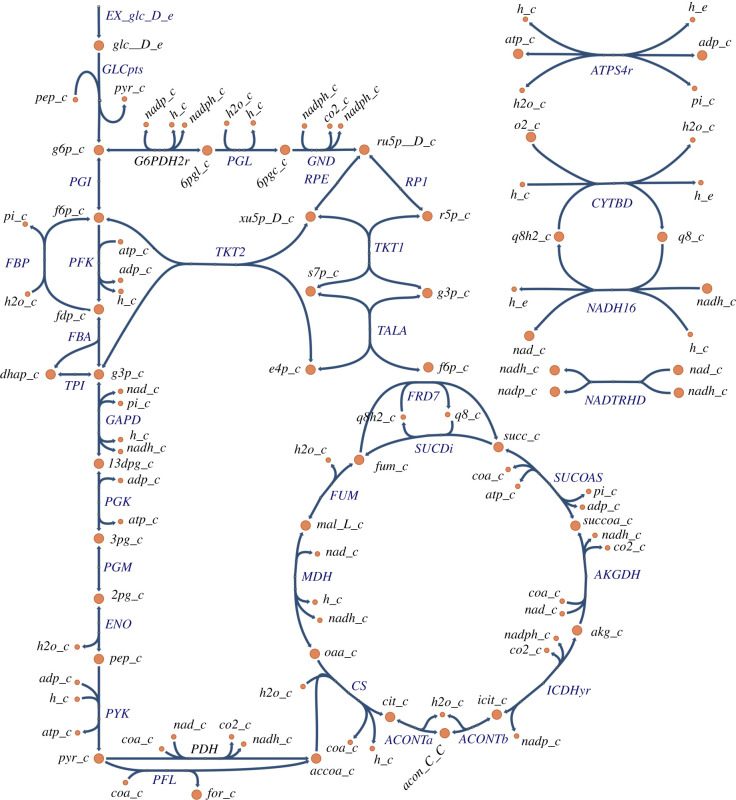
Figure 3.
Escherichia coli core model. The extracted reactions corresponding to the glycolysis, pentose phosphate pathways and TCA cycle parts of the model are shown; a complete list of reactions is given in appendix D. The diagram was created using Escher [68].

