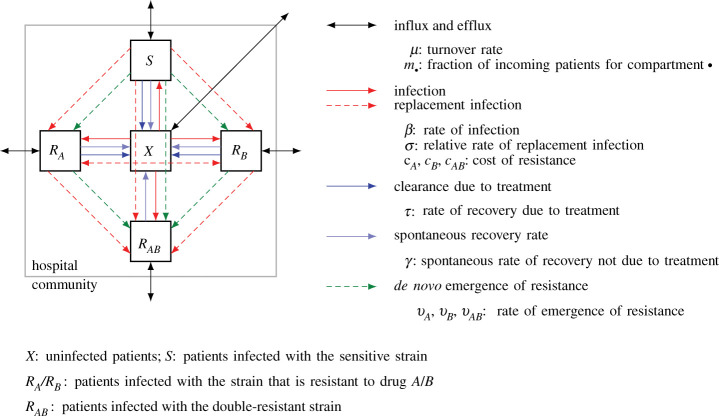
Figure 1.
Flow diagram of the model defined by equation (2.1). The diagram shows the five model compartments and the processes that lead to patient flow between them. Solid lines describe epidemiological processes; processes marked by dashed lines involve evolution and competition between strains at the within-host level. Adapted from [17,18].

