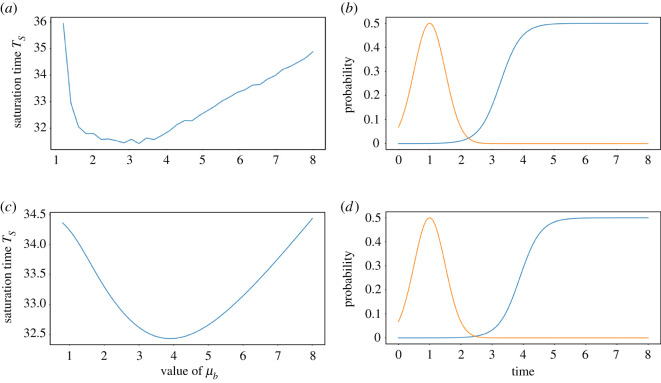
Figure 2.
(a) Mean saturation time TS as a function of μb in the stochastic model, for p = 3. The means are taken over 10 000 simulations for each point. (b) Adaptation probability for the optimal μb (blue) found in (a) and fixed repair probability (orange). (c) Saturation time TS as a function of the value of μb for the deterministic model, for p = 3. (d) Adaptation probability for the optimal μb (blue) found in (c) and fixed repair probability (orange).

