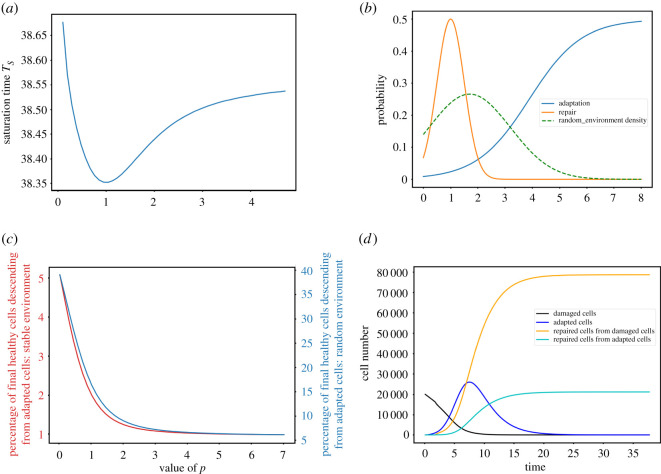
Figure 5.
(a) Saturation time TS as a function of p in a Gaussian random environment for the moment when the damage source stops with mean 1.7 and variance 2.25 (see (b)), for μb = 3.886. (b) Adaptation probability for the optimal p (blue) and fixed repair probability (orange). The dashed curve represents the Gaussian probability density of the random environment. (c) Fraction of cells (in %) in the final healthy population that are descended from adapted cells as a function of p, in a random (blue, right y-axis) or stable (red, left y-axis) environment. (d) Evolution in time of the four cell subpopulations (damaged cells, adapted cells, repaired cells directly from damaged cells and repaired cells descended from adapted cells), with μb = 3.886 and p = 1, averaged over the distribution of the random environment.

