
Figure 4. Relative Ranking of 4 Medical Centers.
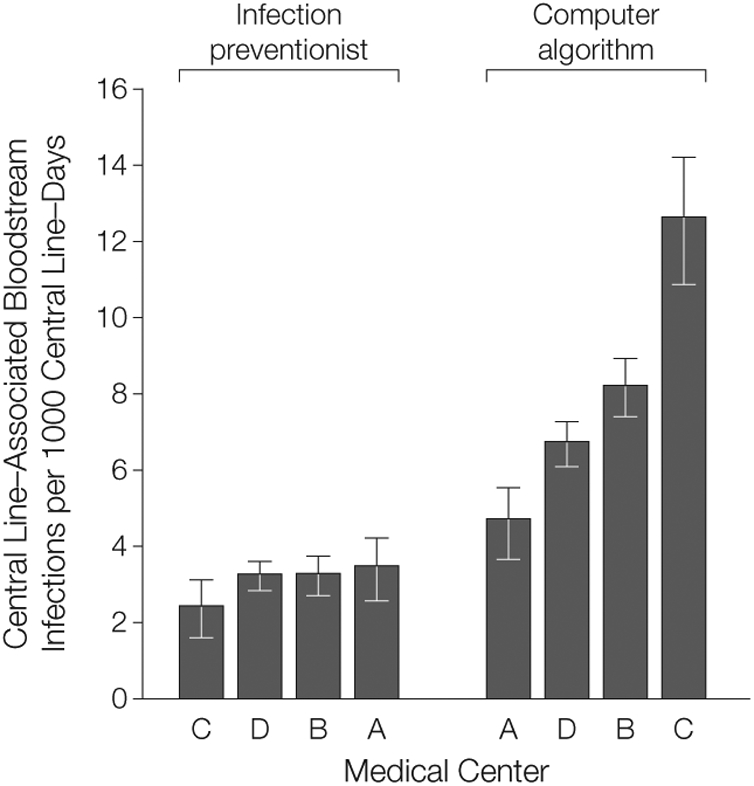
Within each surveillance group, medical centers are arranged in ascending order by central line–associated bloodstream infection rate. Error bars indicate 95% confidence intervals. Rates were calculated within each medical center by aggregating all intensive care unit rates. With infection preventionist surveillance, the following rates were determined: C, 2.4 (95% CI, 1.8-3.3); D, 3.2 (95% CI, 2.9-3.7); B, 3.3 (95% CI, 2.8-3.8); A, 3.5 (95% CI, 2.7-4.4). With the computer algorithm the following infection rates were determined: A, 4.7 (95% CI, 3.8-5.7); D, 6.7 (95% CI, 6.2-7.3); B, 8.2 (95% CI, 7.4-9.0); C, 12.6 (95% CI, 11.0-14.3).