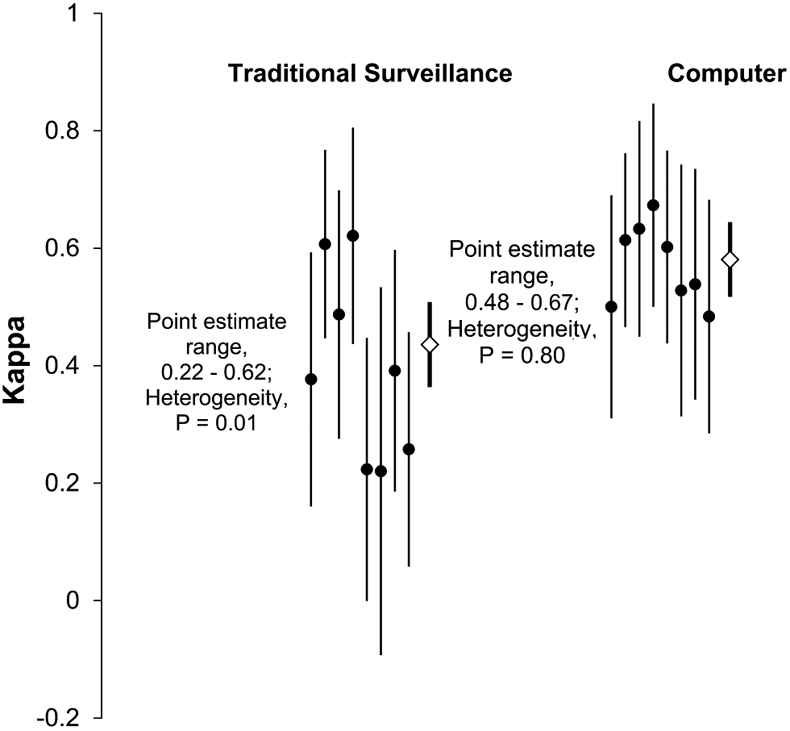
FIGURE 2.

Distribution of κ estimates for traditional surveillance and computer algorithm surveillance, both compared with audit review. Solid circles represent κ point estimates of individual intensive care units. Diamonds represent summary point estimates. Vertical lines represent 95% confidence intervals of the κ estimates.
