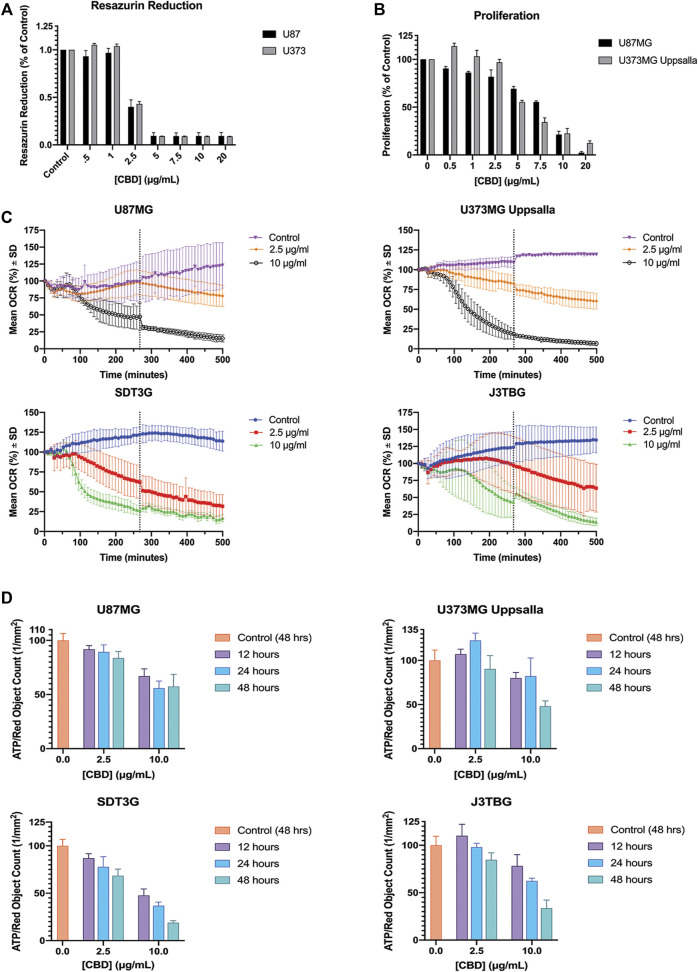
FIGURE 3.
CBD perturbs mitochondrial activity at lethal and non-lethal concentrations. (A) Glioma cell lines U87MG and U373MG Uppsala were treated with CBD isolate (0–20 ug/mL) for 96 h. Cell viability was determined via resazurin-based metabolic assay. Data (arbitrary fluorescence units) were normalized to the vehicle treated control. Representative of n = 3 independent experiments, expressed as mean ± SD. (B) Glioma cell lines U87MG and U373MG Uppsala were treated with CBD isolate (0–20 μg/ml) for 96 h. Cell proliferation was measured via IncuCyte™ Red Object Count. Data shown are from n = 3 independently repeated experiments, expressed as mean ± SD. (C) Glioma cells were measured for baseline oxygen consumption for 30 min, then treated with CBD at lethal (10 μg/ml) and non-lethal (2.5 μg/ml) concentrations. OCR was monitored for 500 min using the SeaHorse XF24. Data shown are from n = 3 independent biological replicates until x = 267 min (vertical dashed grey line) at which point the subsequent data are from n = 2 independent biological replicates. Data are expressed as mean ± SD. (D) U87MG, U373, J3Tbg, and SDT3G Glioma cells were treated with CBD isolate (2.5, 10 μg/ml) for 12, 24, and 48 h. Cellular ATP production was determined via ATP luminescence kit. Data (fluorescence) were interpolated via standard curve, corrected for proliferation (Red Object Count via Incucyte™) and normalized to the 48-h vehicle treated control. Data shown are from n = 2 independent experiments. Data are expressed as mean ± SD.

