
Figure 1.
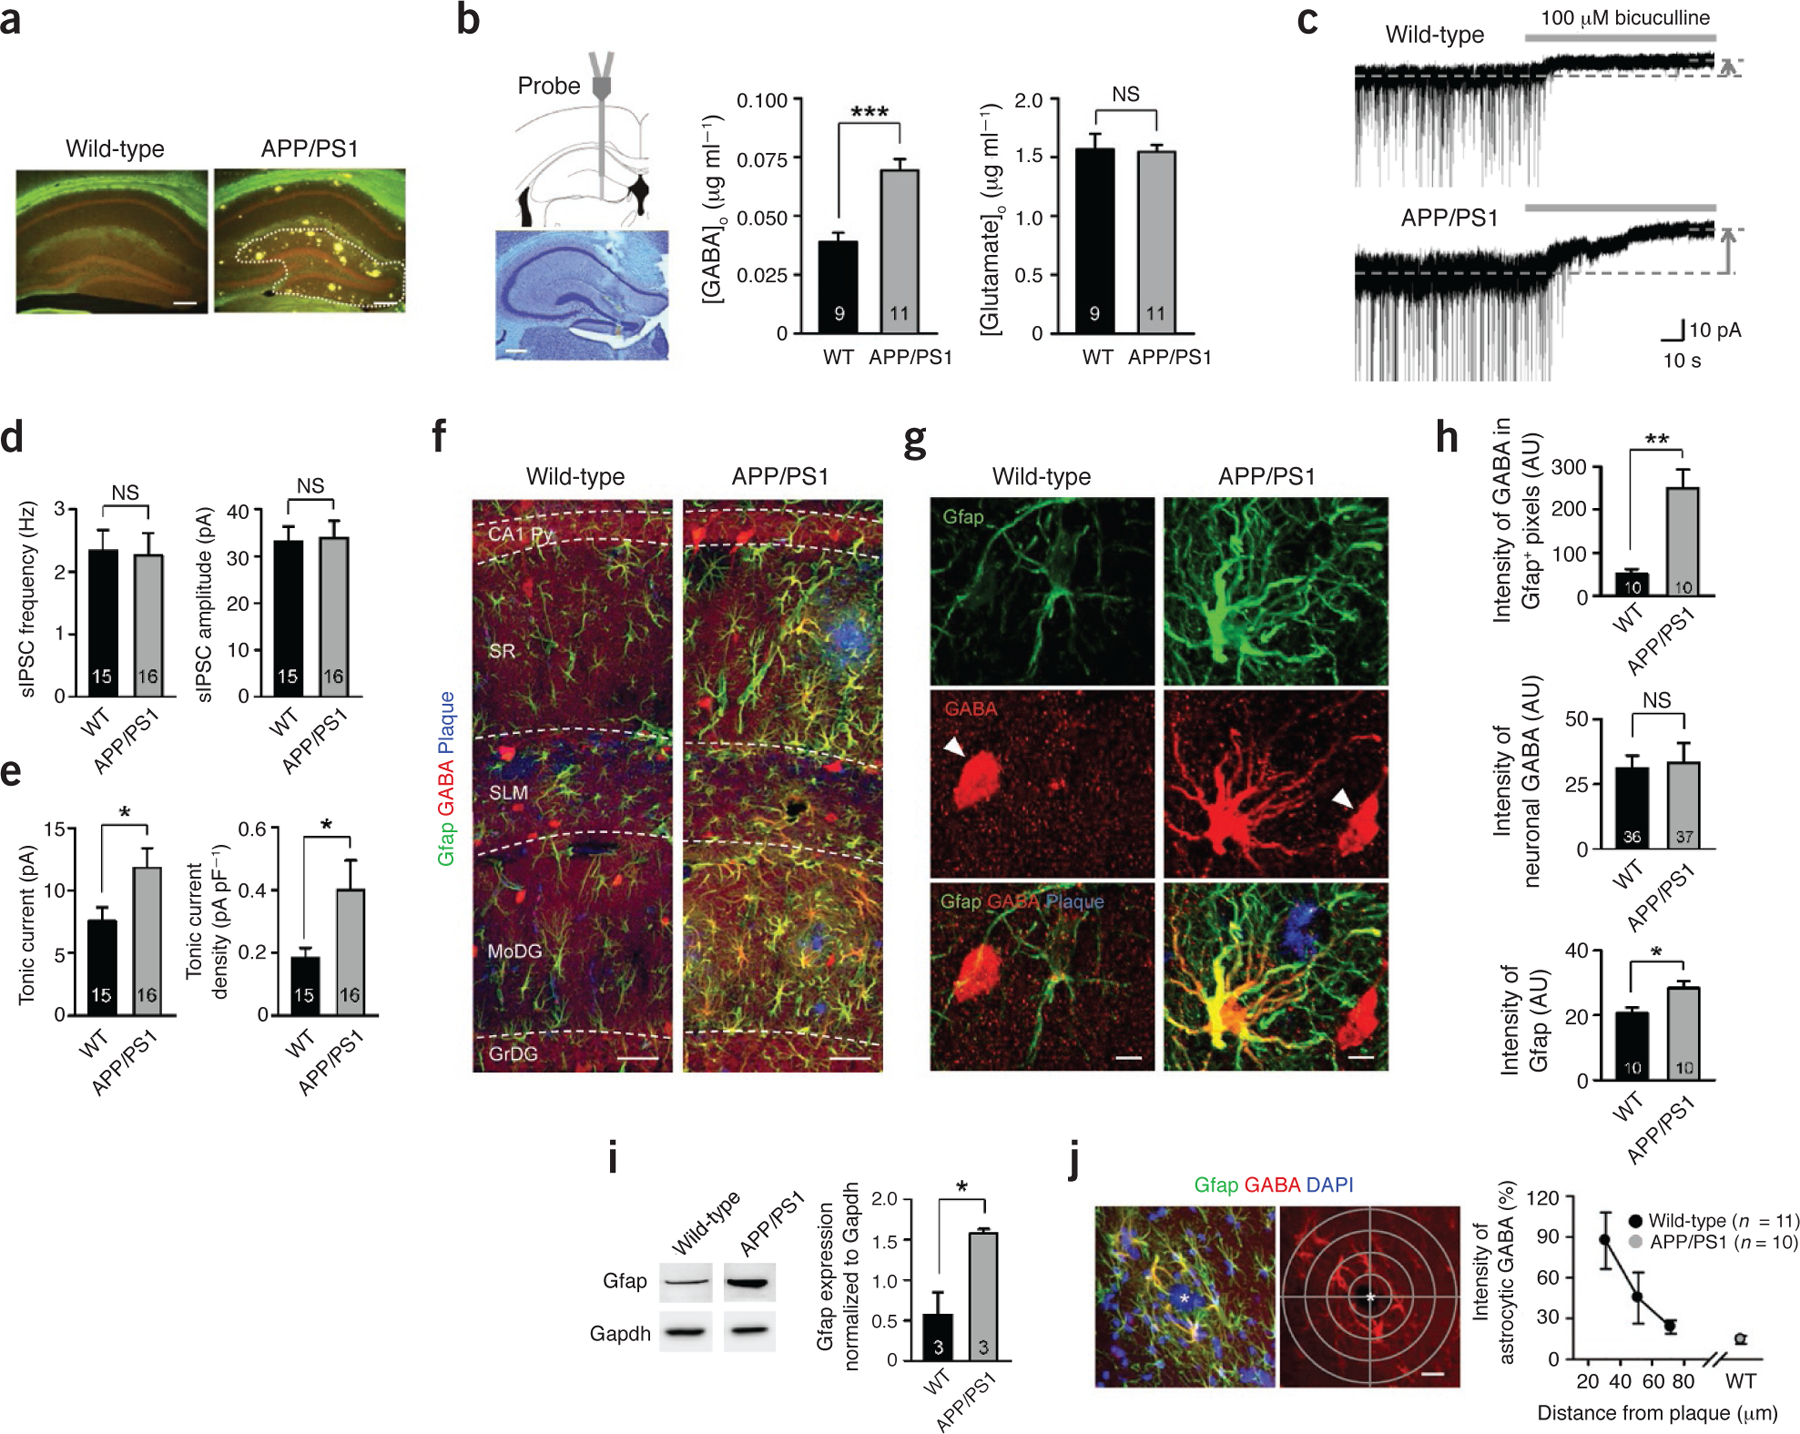
Increased tonic GABA release and GABA immunoreactivity in reactive astrocytes. (a) Thioflavin-S staining of amyloid plaques (yellowish green) in the hippocampus. Dotted line indicates DG (n ≥ 10 for each group; males at 10 months of age; scale bar, 200 μm). (b) In vivo microdialysis (males at 10–11 months of age). Left, validation of microdialyzed sites by cresyl violet staining (scale bar, 200 μm). Middle, GABA levels in dialysate measured by HPLC. ***P < 0.001 (Student’s t-test). Right, glutamate levels. NS, P > 0.05 (Student’s t-test). [GABA]o or [Glutamate]o, the concentrations of GABA or glutamate in outer space of cells. WT, wild type. (c) Representative trace of GABAA receptor–mediated current recorded from granule cells of the DG (n = 4 for WT; n = 7 for APP/PS1; both sexes at 8.5–13 months of age). Dashed lines and arrows indicate baseline shift with bicuculline (100 μM) application (gray bar). (d) Left, frequency of sIPSCs before bicuculline application. Right, amplitude of sIPSCs before bicuculline application. (e) Left, amplitude of tonic GABA current. *P < 0.05 (Student’s t-test). Right, density of tonic GABA current measured by dividing current amplitude by membrane capacitance. *P < 0.05 (Student’s t-test). (f–h) Immunostaining and quantification of images taken from the molecular layer of DG (n = 5 for each group; both sexes at 8–11 months of age). (f) Representative confocal images of Gfap-, GABA- and thioflavin-S–stained plaques (scale bar, 20 μm). SR, striatum radiatum; SLM, striatum lacunosum moleculare; Py, pyramidal neuron layer; MoDG, molecular layer of dentate gyrus; GrDG, granule cell layer of dentate gyrus. (g) High-magnification images of an astrocyte. Arrowheads indicate GABAergic neurons (scale bar, 5 μm). (h) Top, mean intensity of GABA in GFAP-positive areas. **P < 0.01, *P < 0.05 (Student’s t-test). AU, arbitrary units. Middle, mean intensity of interneuronal GABA. Bottom, mean intensity of Gfap. (i) Left, representative western blots of Gfap in the DG (n = 3 for each group; both sexes at 11–11.5 months of age). Right, quantification of Gfap by densitometry. *P < 0.05 (Student’s t-test). (j) Left, a graticule with 20-μm density (gray) focused at the center of plaque (asterisks) was applied to confocal images (scale bar, 20 μm). Right, normalized intensity of astrocytic GABA according to the distance from the center of a plaque. 0% indicates background intensity, and 100% indicates the mean intensity of neuronal GABA in the same confocal image. Number on each bar refers to the number of mice (b,i), slices (d), images (h top and bottom, j), and cells (h middle) analyzed. n refers to the number of animals studied. Data are means ± s.e.m.