
Figure 3.
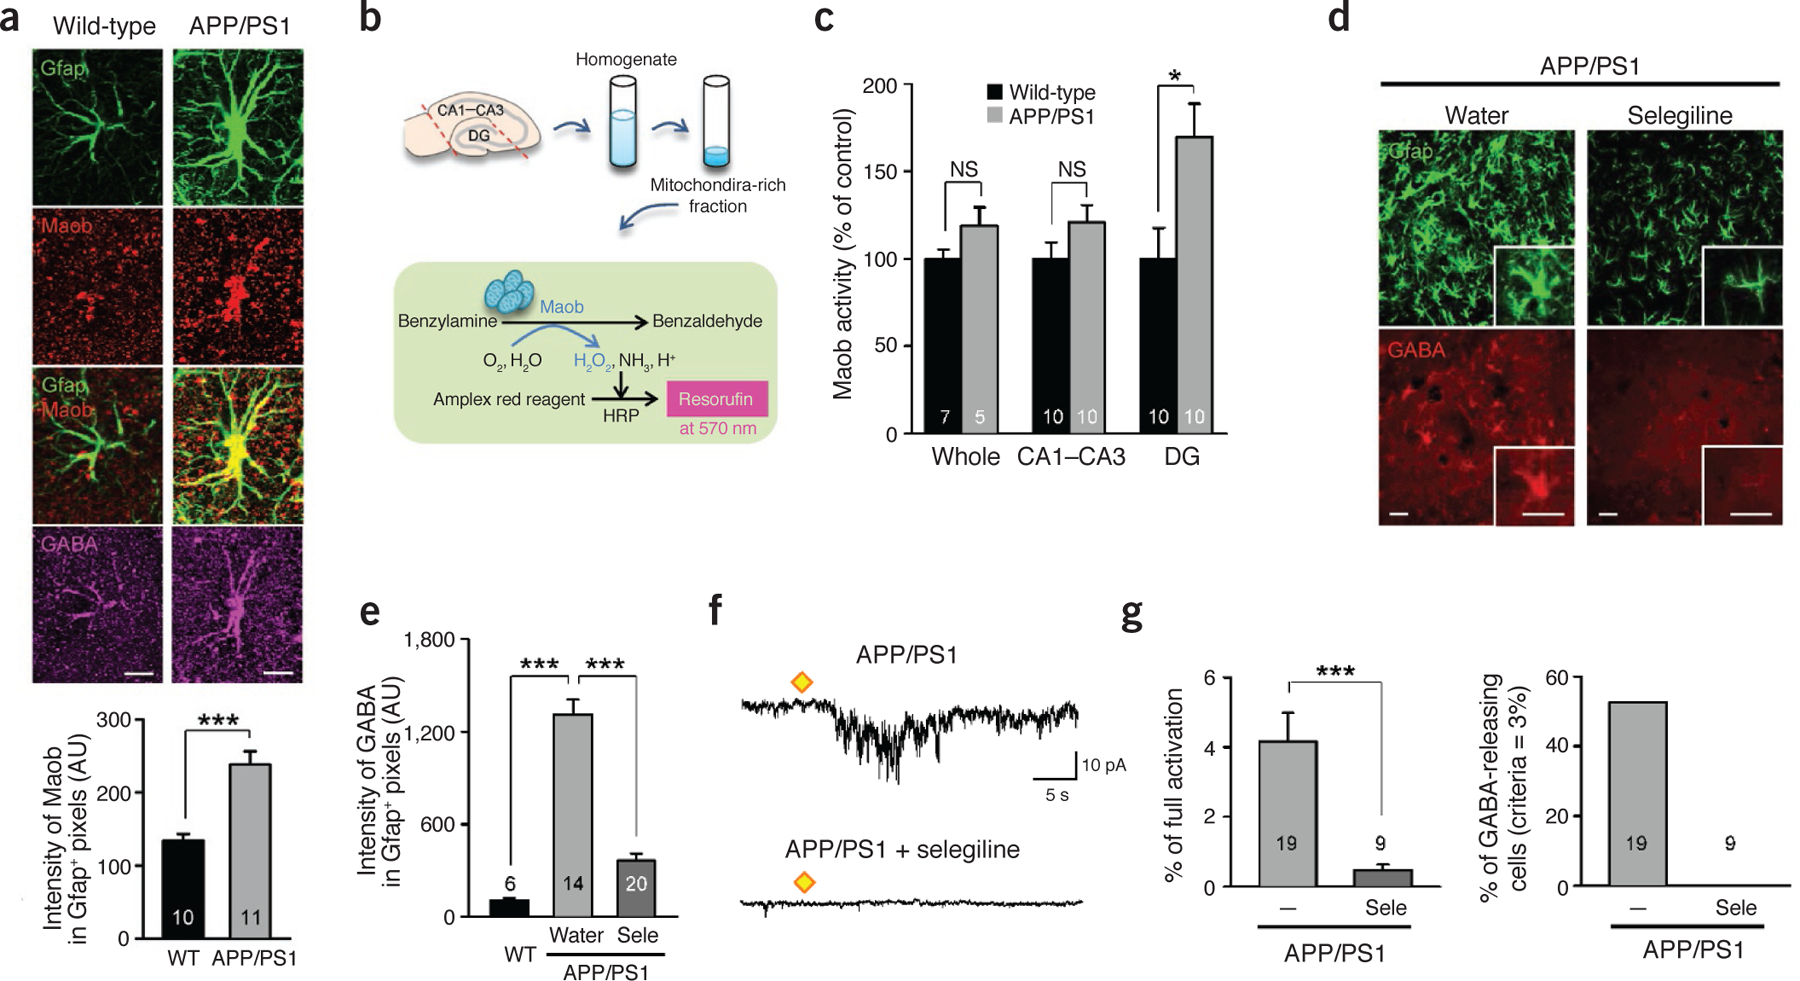
Maob is responsible for GABA production in reactive astrocytes. (a) Immunostaining and quantification of Maob in the molecular layer of DG (females at 10 months of age). Top, representative confocal images of an astrocyte (scale bar, 10 μm). Bottom, mean intensity of Maob in Gfap-positive areas. ***P < 0.001 (Student’s t-test). (b) Reaction diagram of the enzyme activity assay of Maob in the hippocampus. (c) Maob activity normalized to the activity of wild-type mice in the whole hippocampus or subregions (n = 7 for wild-type whole; n = 5 for other groups; For CA1–CA3 and DG groups, left and right hippocampus were analyzed separately; males at 12 months of age). *P < 0.05 (Student’s t-test). (d,e) Immunostaining and quantification of astrocytic GABA after oral administration of selegiline (Sele; 10 mg kg‒1 d‒1 for 3 d) in APP/PS1 mice (n = 1 for wild-type; n = 3 for APP/PS1 with water; n = 4 for APP/PS1 with Sele; males at 12 months of age). (d) Representative confocal images of Gfap and GABA in the molecular layer of DG. Inset, magnified images. Scale bars, 30 μm for both main images and the insets. (e) Mean intensity of GABA in Gfap-positive areas. ***P < 0.001 (Student’s t-test). (f,g) Measurement of GABA release from acutely dissociated hippocampal astrocytes (n = 4 for APP/PS1; n = 1 for APP/PS1 + selegiline; males at 8–18 months of age). (f) Representative trace of sensor current induced by GABA from an astrocyte of an APP/PS1 mouse and an astrocyte from an APP/PS1 mouse with selegiline treatment (100 nM). Diamonds, TFLLR puffing (500 μM, 100 ms, 10 p.s.i.). The APP/PS1 group is the same group from Figure 2b. (g) Left, peak amplitude of GABAC current normalized to full activation. ***P < 0.001 (Student’s t-test). Right, percentage of GABA-releasing astrocytes of which peak amplitude measured by sensor cell is higher than 3% of full activation. The APP/PS1 group is the same group from Figure 2c. Number on each bar refers to the number of hippocampi (c), images (e) or cells (a,g) analyzed. n refers to the number of animals studied. Data are means ± s.e.m.