
Figure 5.
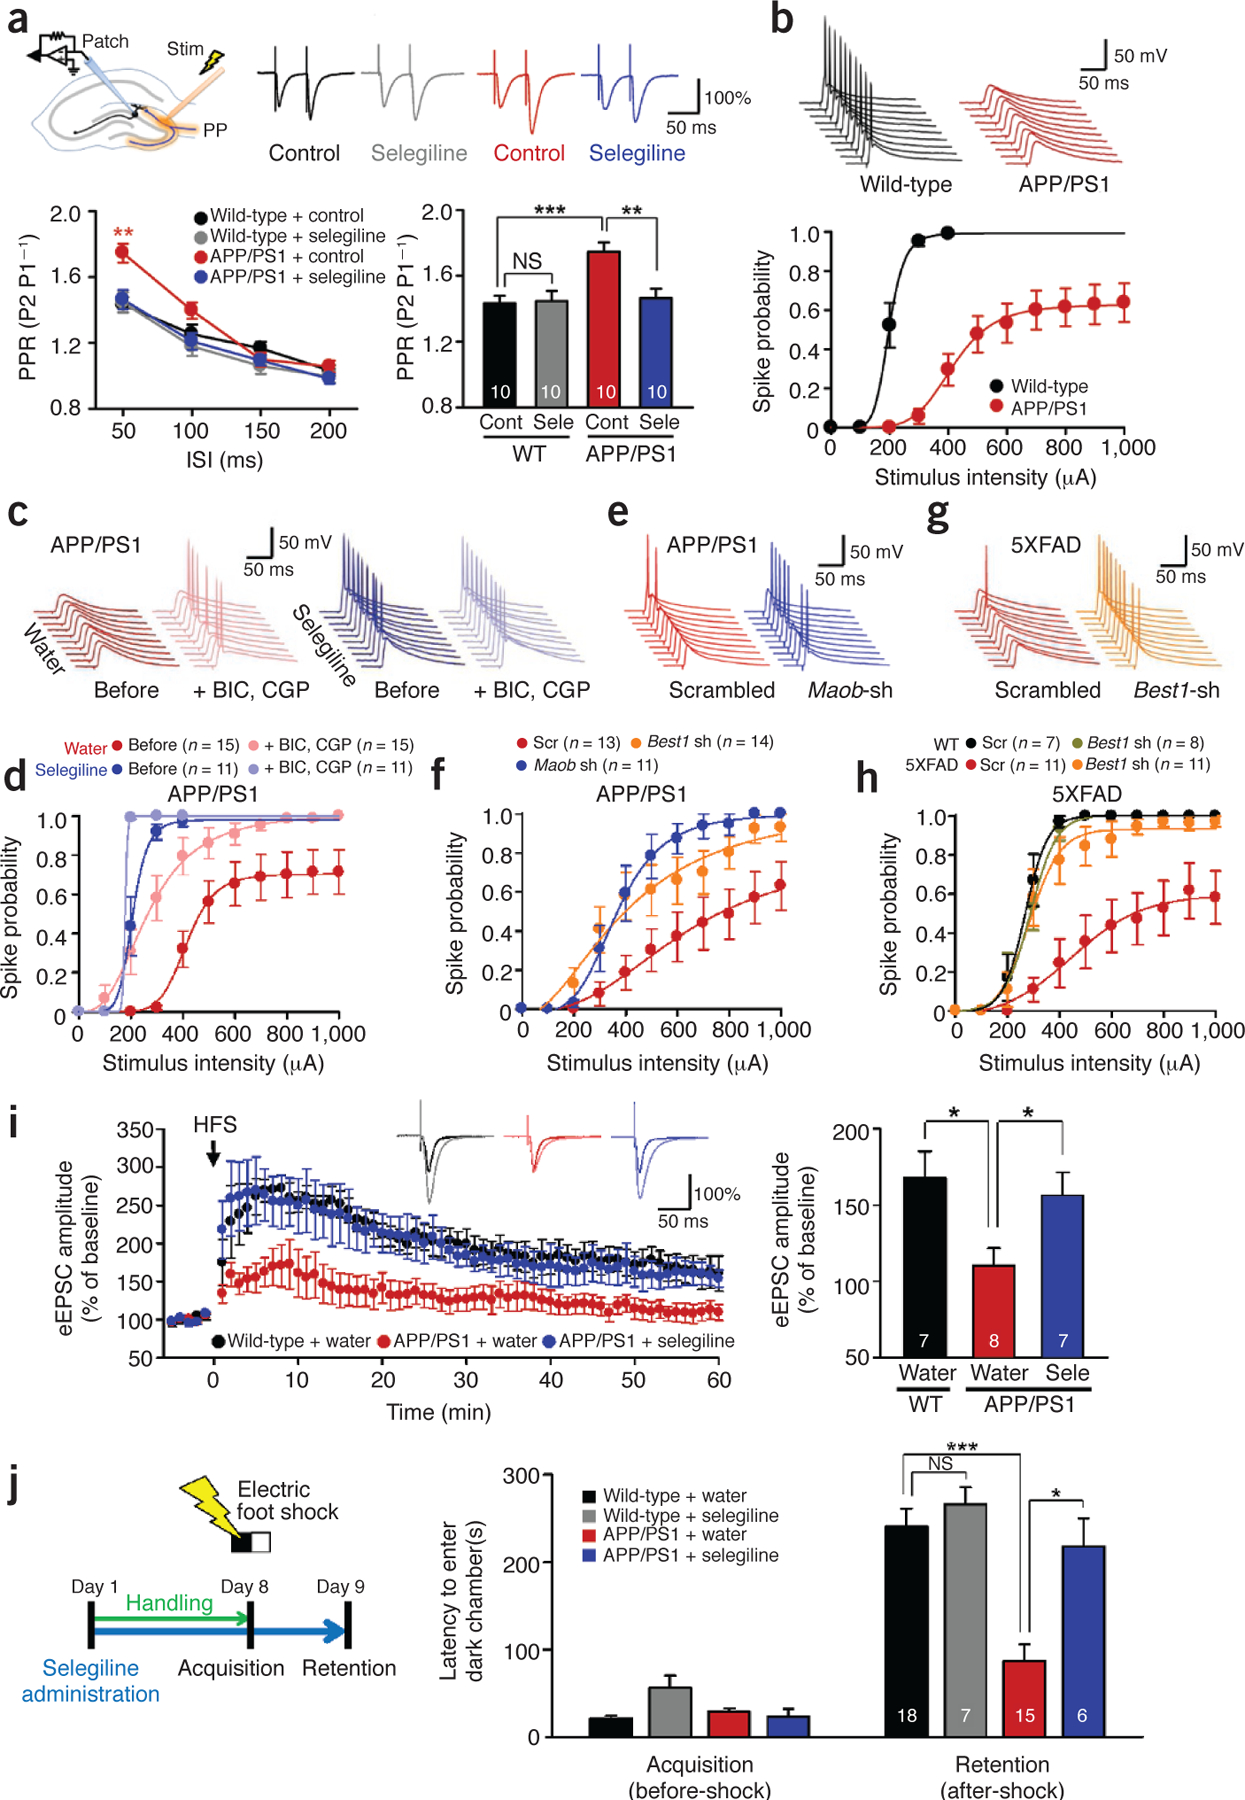
Impaired presynaptic release probability, spike probability, synaptic plasticity, and learning and memory are fully rescued by targeting Maob or Best1. (a) PPR of eEPSCs recorded from dentate granule cells in wild-type and APP/PS1 mice with or without pretreatment with selegiline (100 μM) (n = 2 for each group; both sexes at 12–12.5 months of age). Top left, schematic diagram for input-output relationship, PPR, spike probability and LTP experiments in granule cells of DG. Stim, electrical stimulation; PP, perforant path. Top right, representative traces of eEPSCs evoked by paired-pulse stimuli at 300-μA intensity and 50-ms interpulse interval. Data are representative of >10 recordings and 2 experiments. Bottom left, PPR of eEPSCs plotted as a function of interspike intervals (ISIs). P < 0.05 for drug (two-way repeated-measures ANOVA); **P < 0.01 for APP/PS1 + control at 50 ms (one-way ANOVA and Bonferroni’s test). Bottom right, mean PPR measured at 50-ms interspike interval. **P < 0.01, ***P < 0.001 (two-way ANOVA and Bonferroni’s test). (b) Evoked spike probability by electrical stimulation of perforant path (0.1 Hz, 100 μs, 100–1,000 μA) (n = 3 for each group; both sexes at 12–13 months of age). Top, representative traces of evoked EPSPs and action potentials at 300-μA stimulation. Bottom, summary graph of spike probability versus stimulus intensity. (c) Representative trace of evoked EPSPs in the DG granule cells of APP/PS1 mice treated with GABA receptor antagonists (BIC: 10 μM bicuculline, CGP: 5 μM CGP55845) and the Maob inhibitor selegiline (10 mg kg‒1 d‒1 oral administration for 7 d) at 300-μA stimulation (n = 3 for water; n = 2 for selegiline; both sexes at 12–13 months of age). Experiments were repeated more than twice. (d) Summary graph of spike probability of granule cells recorded in Figure 5c versus stimulus intensity. (e) Representative traces of evoked EPSPs in the DG granule cells of APP/PS1 mice injected with scrambled, Best1 or Maob shRNA at 400-mA stimulation (n = 3 for scrambled; n = 2 for Best1 shRNA; n = 2 for Maob shRNA; both sexes at 10–11 months of age). Experiments were repeated more than twice. (f) Summary graph of spike probability of granule cells recorded in Figure 5e versus stimulus intensity. (g) Representative traces of evoked EPSPs in the DG granule cells of 5XFAD mice injected with scrambled or Best1 shRNA at 400-mA stimulation (n = 2 for WT scrambled; n = 2 for WT Best1 shRNA; n = 3 for 5XFAD scrambled; n = 3 for 5XFAD Best1 shRNA; males at 7–8 months of age). (h) Summary graph of spike probability of granule cells recorded in Figure 5g versus stimulus intensity. (i) LTP recorded from dentate granule cells of wild-type and APP/PS1 mice with or without oral administration of selegiline (10 mg kg‒1 d‒1 for 7 d). Left, potentiation of perforant path–evoked eEPSCs induced by high-frequency stimulation (HFS, indicated by arrow) in granule cells. Inset traces, representative traces of eEPSCs during 0.1-Hz frequency transmission before and after the induction of potentiation. Shown are eEPSCs recorded at 60 min after the HFS, normalized to the amplitude of the corresponding response in the baseline. Right, mean amplitudes of eEPSCs recorded from 50 to 60 min after HFS. *P < 0.05 (Student’s t-test) (n = 3 for each group; both sexes at 8.5–9 months of age). (j) Passive avoidance test from wild-type and APP/PS1 mice with or without oral administration of selegiline. Left, experimental protocol for passive avoidance test. Right, latency to enter dark chamber during passive avoidance test for wild-type and APP/PS1 mice with or without oral administration of selegiline (10 mg kg‒1 d‒1 for 7 d, both sexes at 10–12 months of age). Two-way repeated-measures ANOVA revealed significant effects for the genotype (F(1,42) = 18.630, P = 0.000), significant effects for the drug (F(1,42) = 12.494, P = 0.001), without significant interaction effect between genotype and drug. ***P < 0.001, *P < 0.05 (Bonferroni’s post hoc analysis). Number on each bar refers to the number of cells (a,b,d,f,h,i) and mice (j) analyzed. n refers to the number of animals tested. Each cell was recorded once for each stimulus intensity. Data are means ± s.e.m.