
Figure 6.
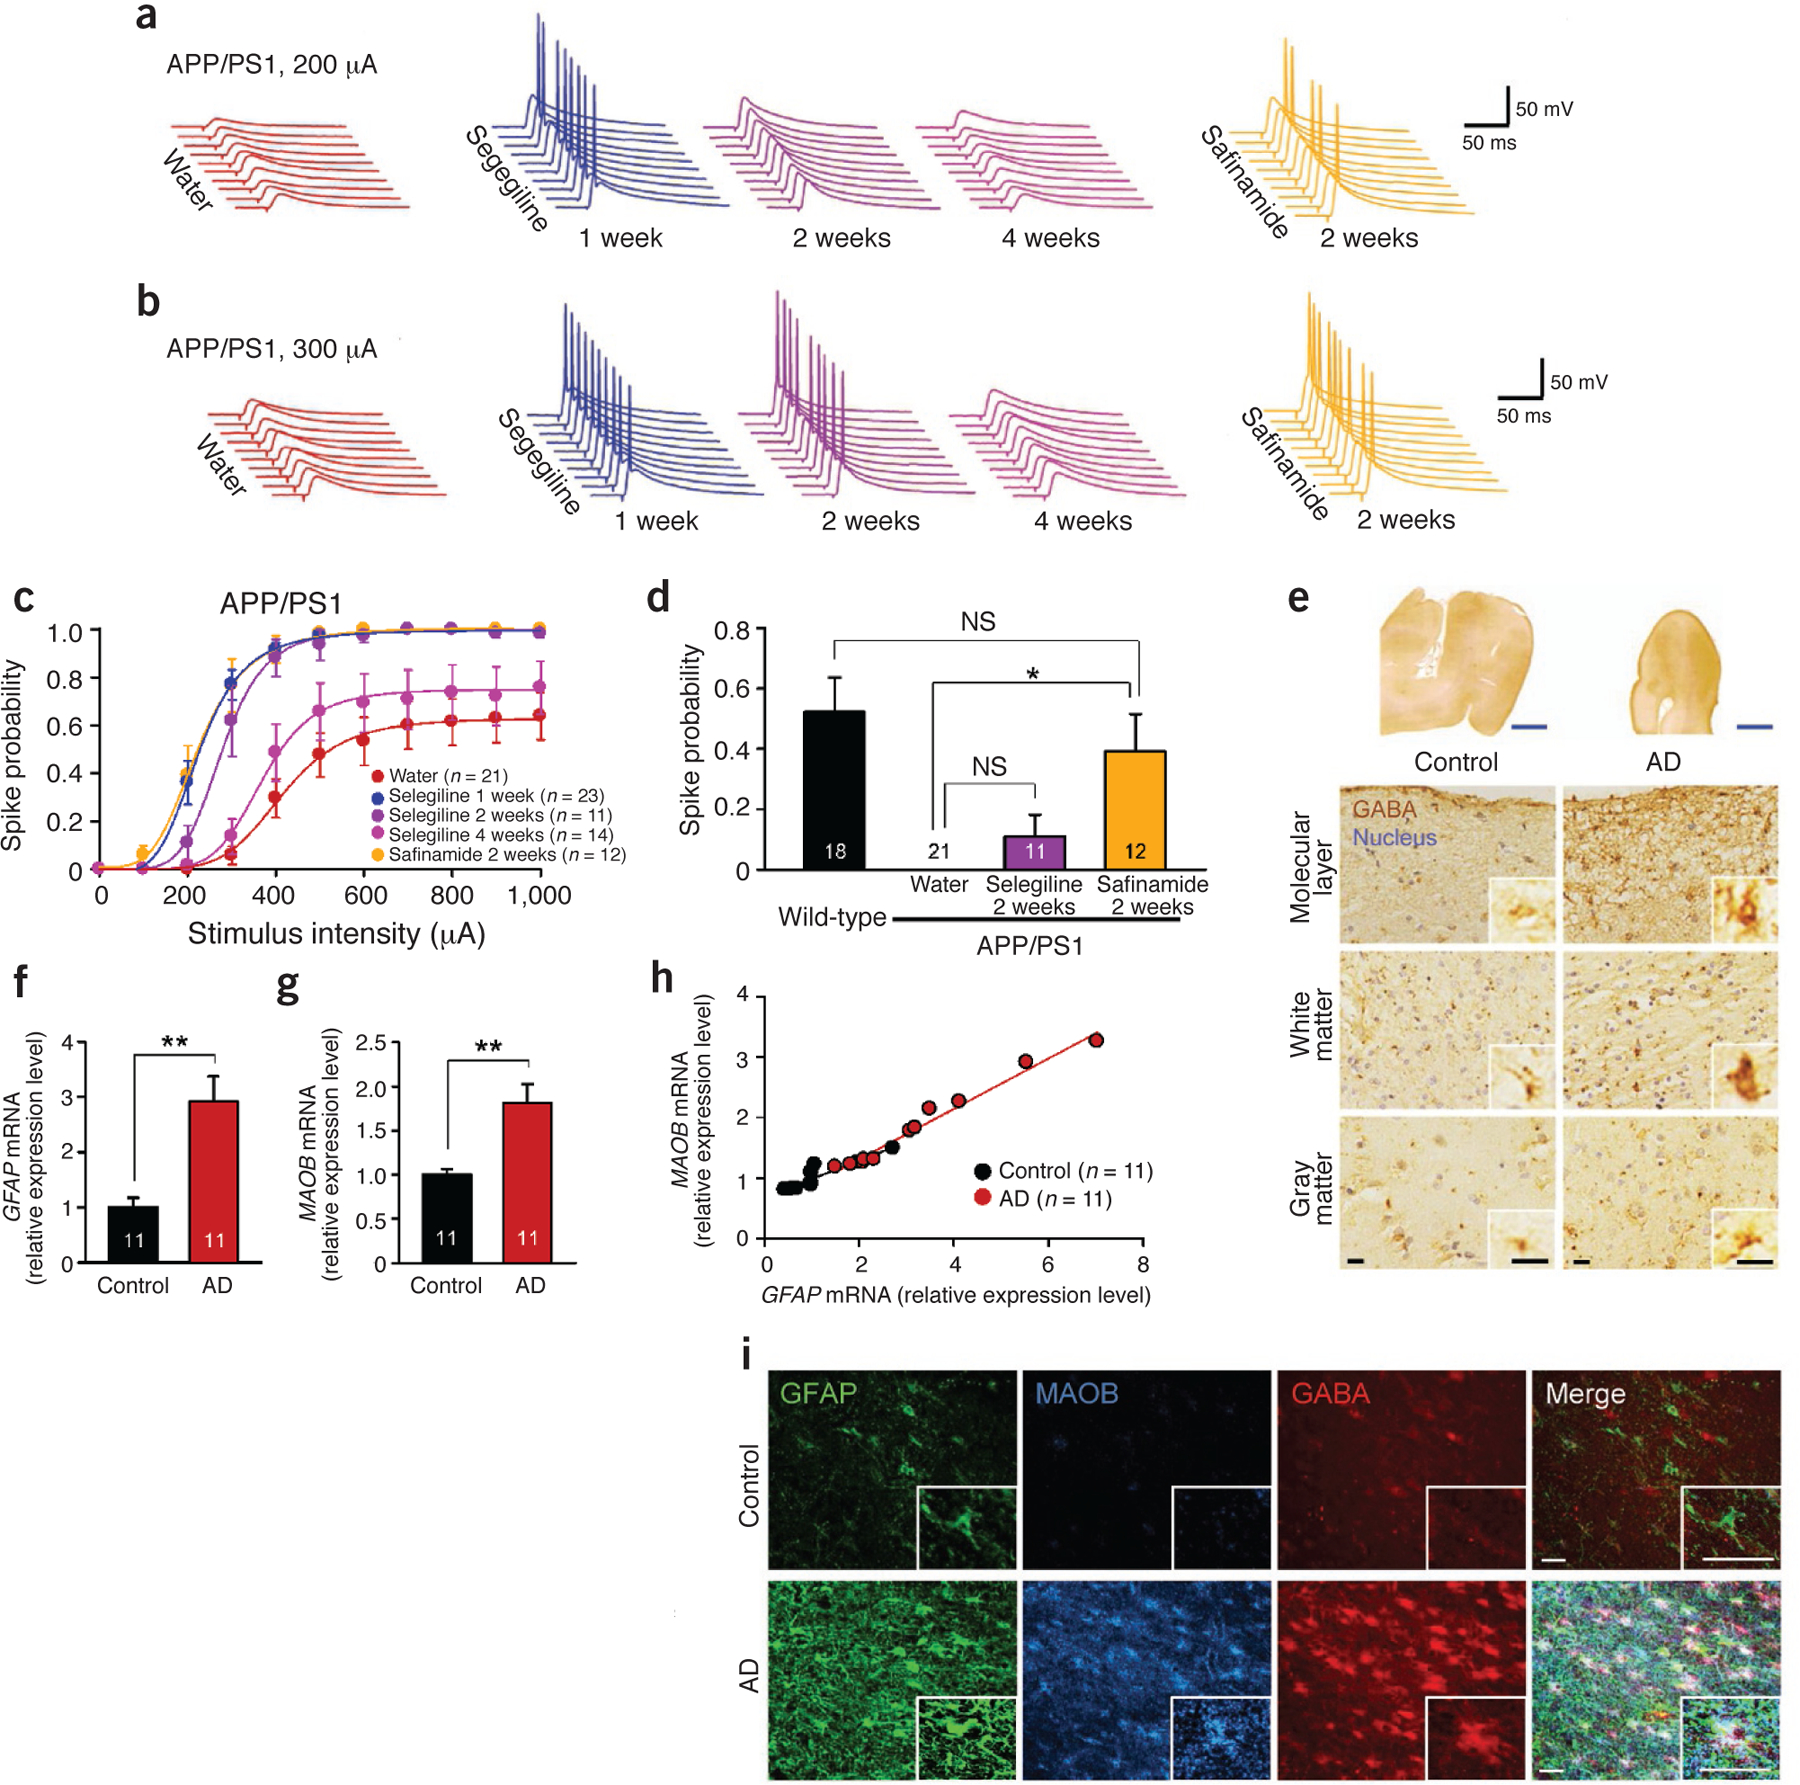
Clinical relevance of GABA from reactive astrocytes. (a–d) Evoked spike probability by electrical stimulation of perforant path (0.1 Hz, 100 μs, 100–1,000 μA) (for selegiline 2 weeks and 4 weeks and safinamide 2 weeks, n = 2 mice for each group; both sexes at 10–12 months of age). Each cell was recorded once for each stimulus intensity. (a) Representative traces of evoked EPSPs with selegiline or safinamide (10 mg kg‒1 d‒1 oral administration) at 200-μA stimulation. (b) Representative traces of evoked EPSPs at 300 μA stimulation. (c) Summary graph of spike probability versus stimulus intensity. Water group is the same group from Figure 5f; selegiline 1-week group includes the 11 cells of the selegiline before group in Figure 5h. (d) Comparison of spike probability at 200-μA stimulation after 2 weeks of administration of Maob inhibitors. Wild-type group and Water group are the same groups from Figure 5f. One-way ANOVA and Scheffe’s test; *P < 0.05. (e) Immunohistochemistry of GABA and hematoxylin-stained nuclei in the temporal cortex of human postmortem brain. Inset, magnified images. Blue scale bars, 5 mm; black scale bars, 15 μm. (f) Relative expression level of GFAP mRNA measured by quantitative real-time PCR. **P < 0.01 (Student’s t-test). (g) Relative expression level of MAOB mRNA. **P < 0.01 (Student’s t-test). (h) Scatter plot shows positive correlation between GFAP and MAOB mRNA extent. Control: r = 0.89, P < 0.0005; subject with AD: r = 0.99, P < 0.0001 (simple correlation analysis). (i) Confocal images of GFAP, MAOB and GABA abundance. Inset, magnified images of AD and control astrocytes. Scale bars, 30 μm. Number on each bar refer to the number of cells (c,d) or human cases (f–h) analyzed. Data are means ± s.e.m.