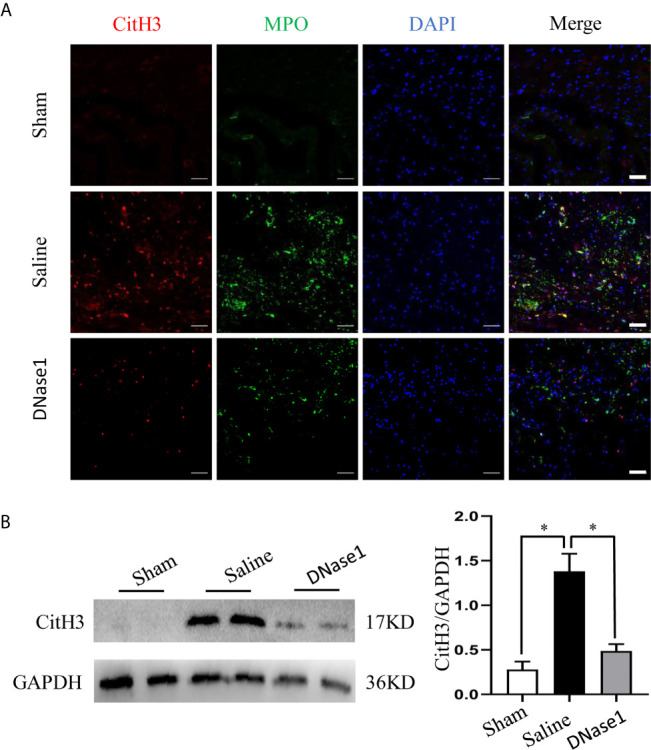
Figure 3.

DNase1 degrades NETs after SCI. (A) Representative images of CitH3 (red) and MPO (green) double-positive cells in spinal cord from each group at 24 h after operation. Nuclear was marked with DAPI (blue). Scale bars = 50 μm. (B) Representative immunoblots and quantification of the CitH3 levels in spinal cord of each group. GAPDH is used as a loading control. Data are presented as means ± SD of n = 9 (*p < 0.05).
