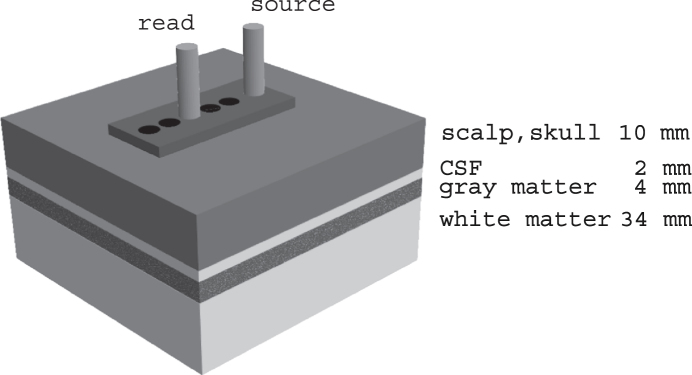
Fig. 1.
Schematic diagram of method for acquiring spectra. At each temple, spectra are obtained at a range of source-detector separations determined by the plastic template (10–30 mm). The 20 mm source-detector configuration is illustrated; the 25 mm spectra are analyzed in this report. The greater the source-detector separation the greater the depth of the mean photon path. The tissues probed and their nominal thicknesses are labelled. For the 25 mm source-detector separation, the mean photon path includes a portion of the gray matter, in this case part of the temporal lobe.

