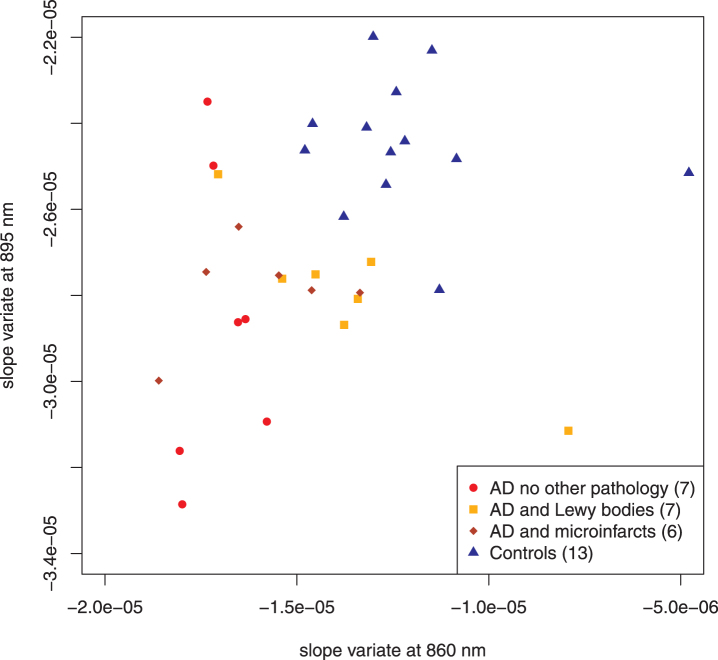
Fig. 4.
Scatter plot adding AD subjects with additional pathology. The addition of the subjects with other pathology increases the dispersion in the AD group but the points remain within the same regions as the previous diagram. Points distinguished as “test” in Fig. 3 have been combined with the discovery set. Parenthetical number is the number of subjects in that group.

