
Figure 2.
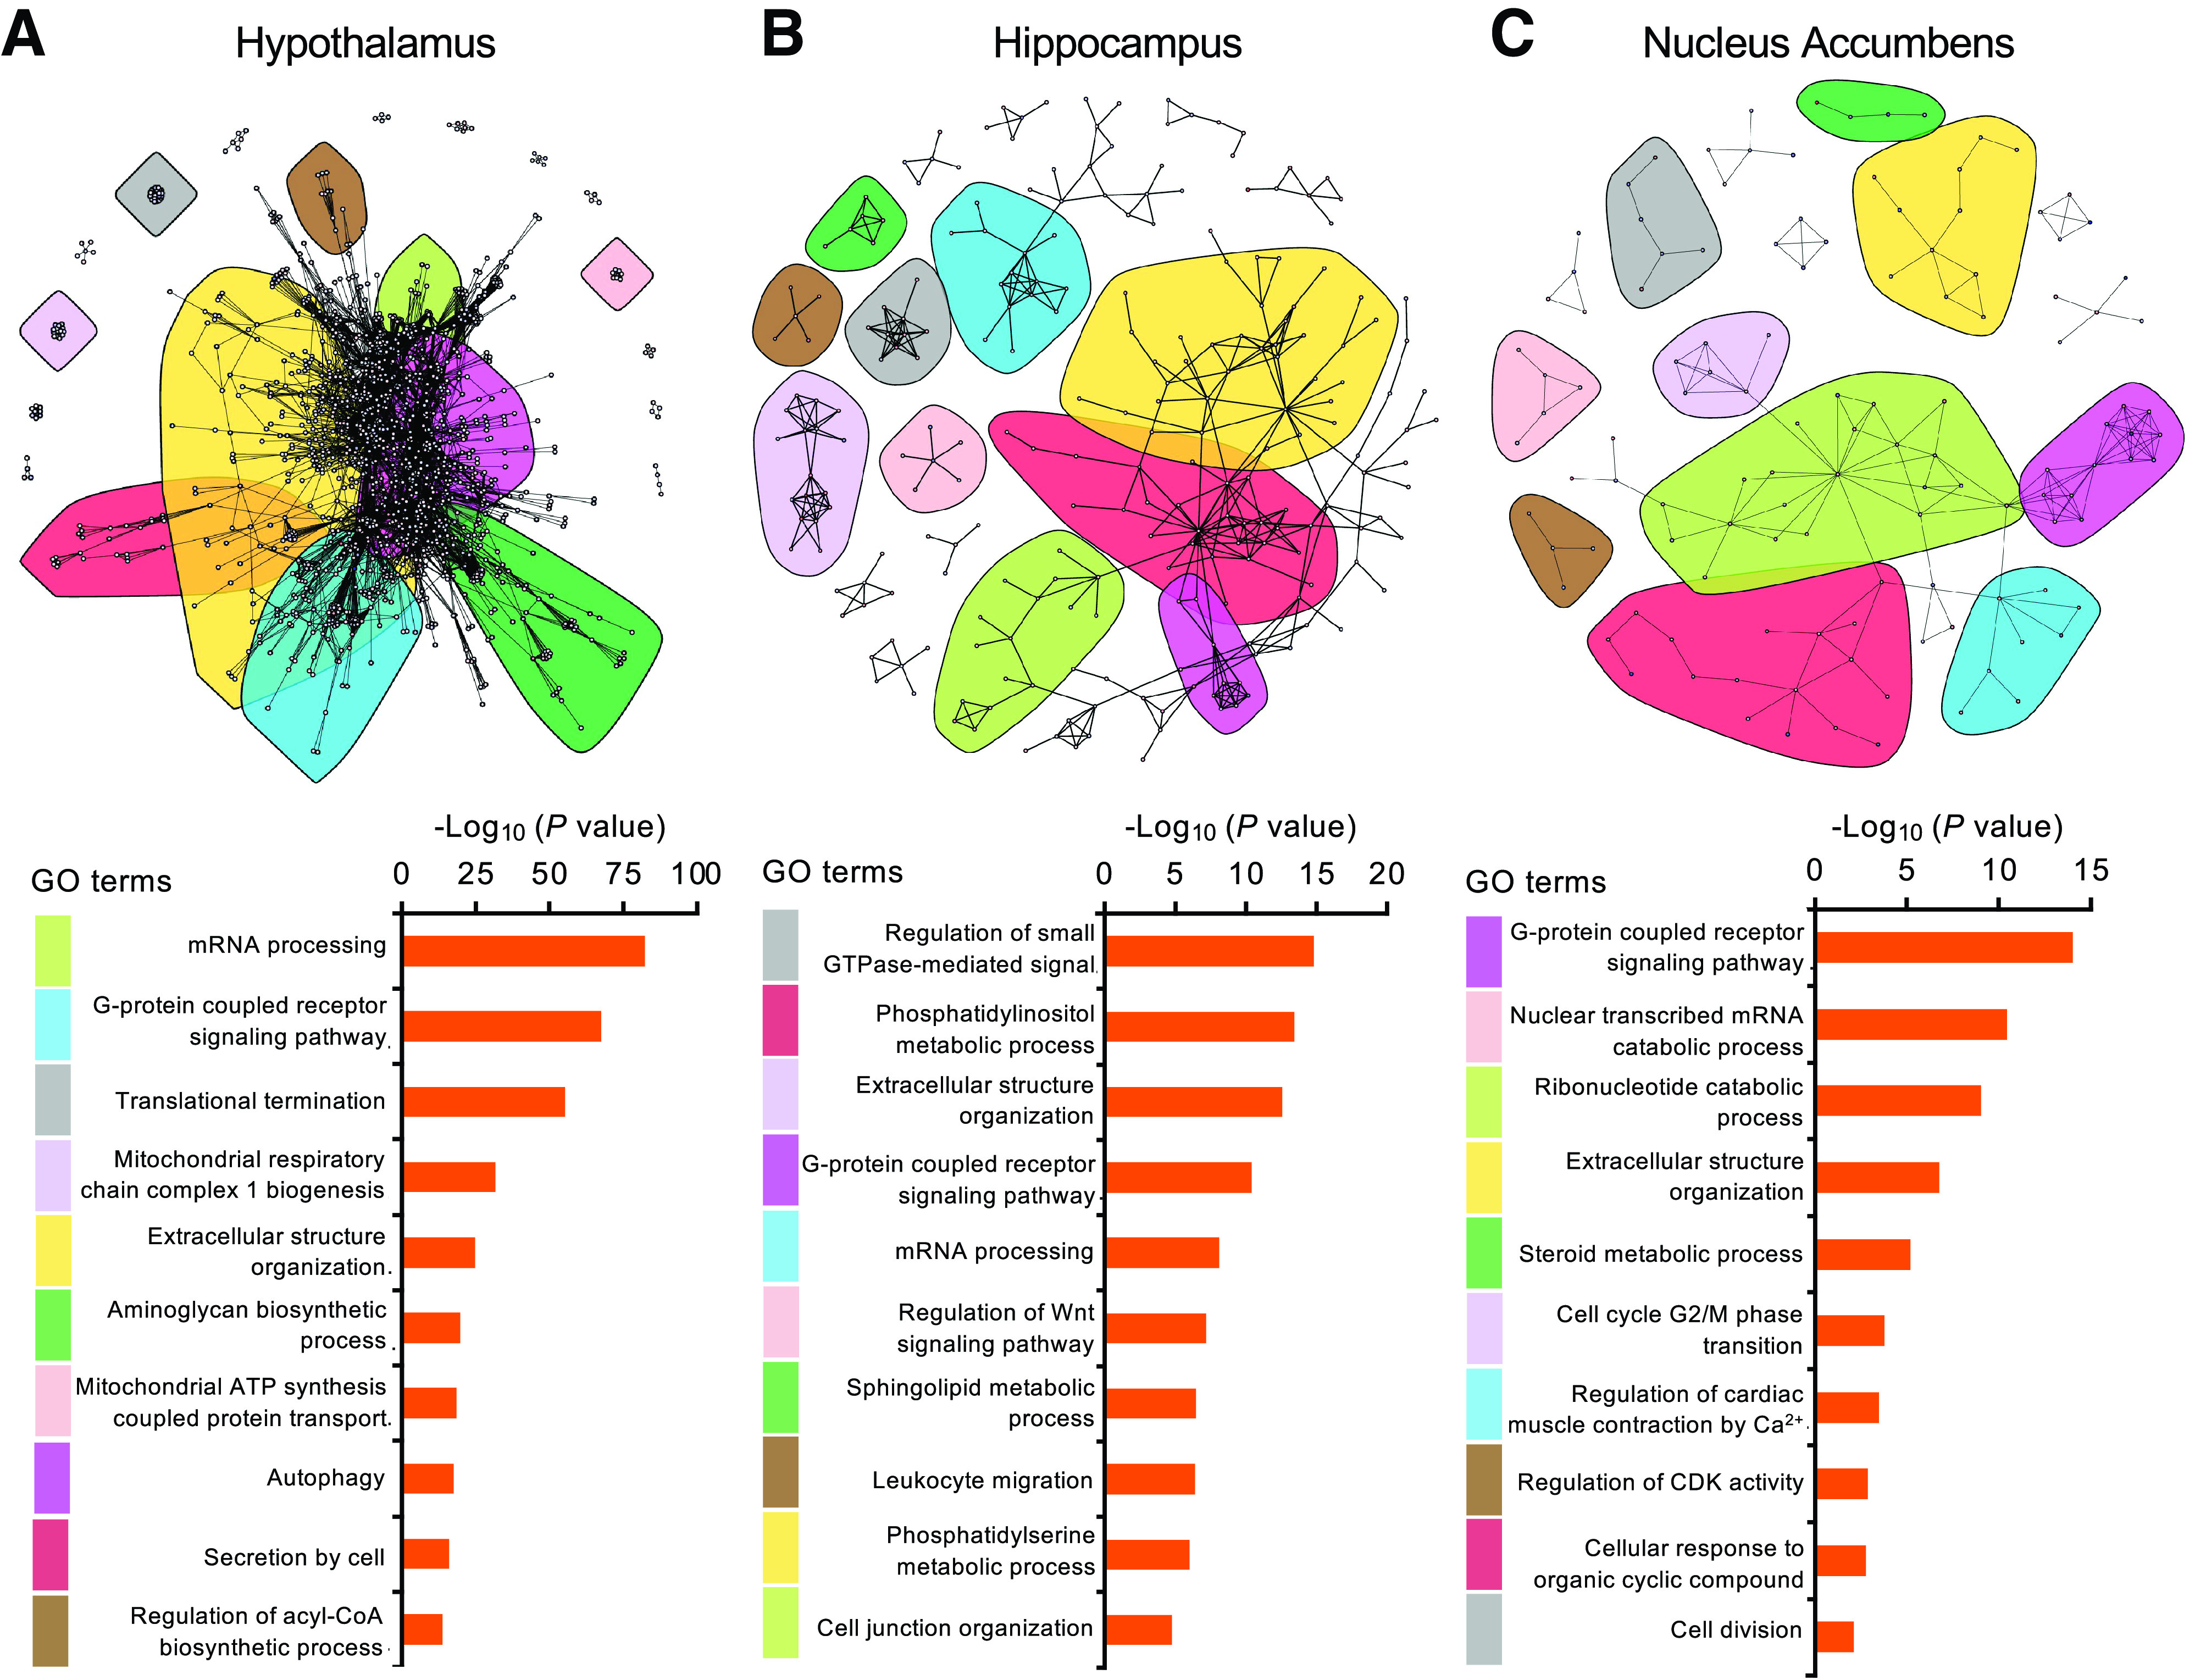
Insulin elicits distinct patterns of gene expression regulation in different brain regions. Community network analysis of significantly regulated genes by insulin in the HTM (A), HCA (B), and NAC (C) (P < 0.05). The top-enriched GO term pathways for the 10 major color-coded clusters are ranked by P value at the bottom.