
Figure 5.
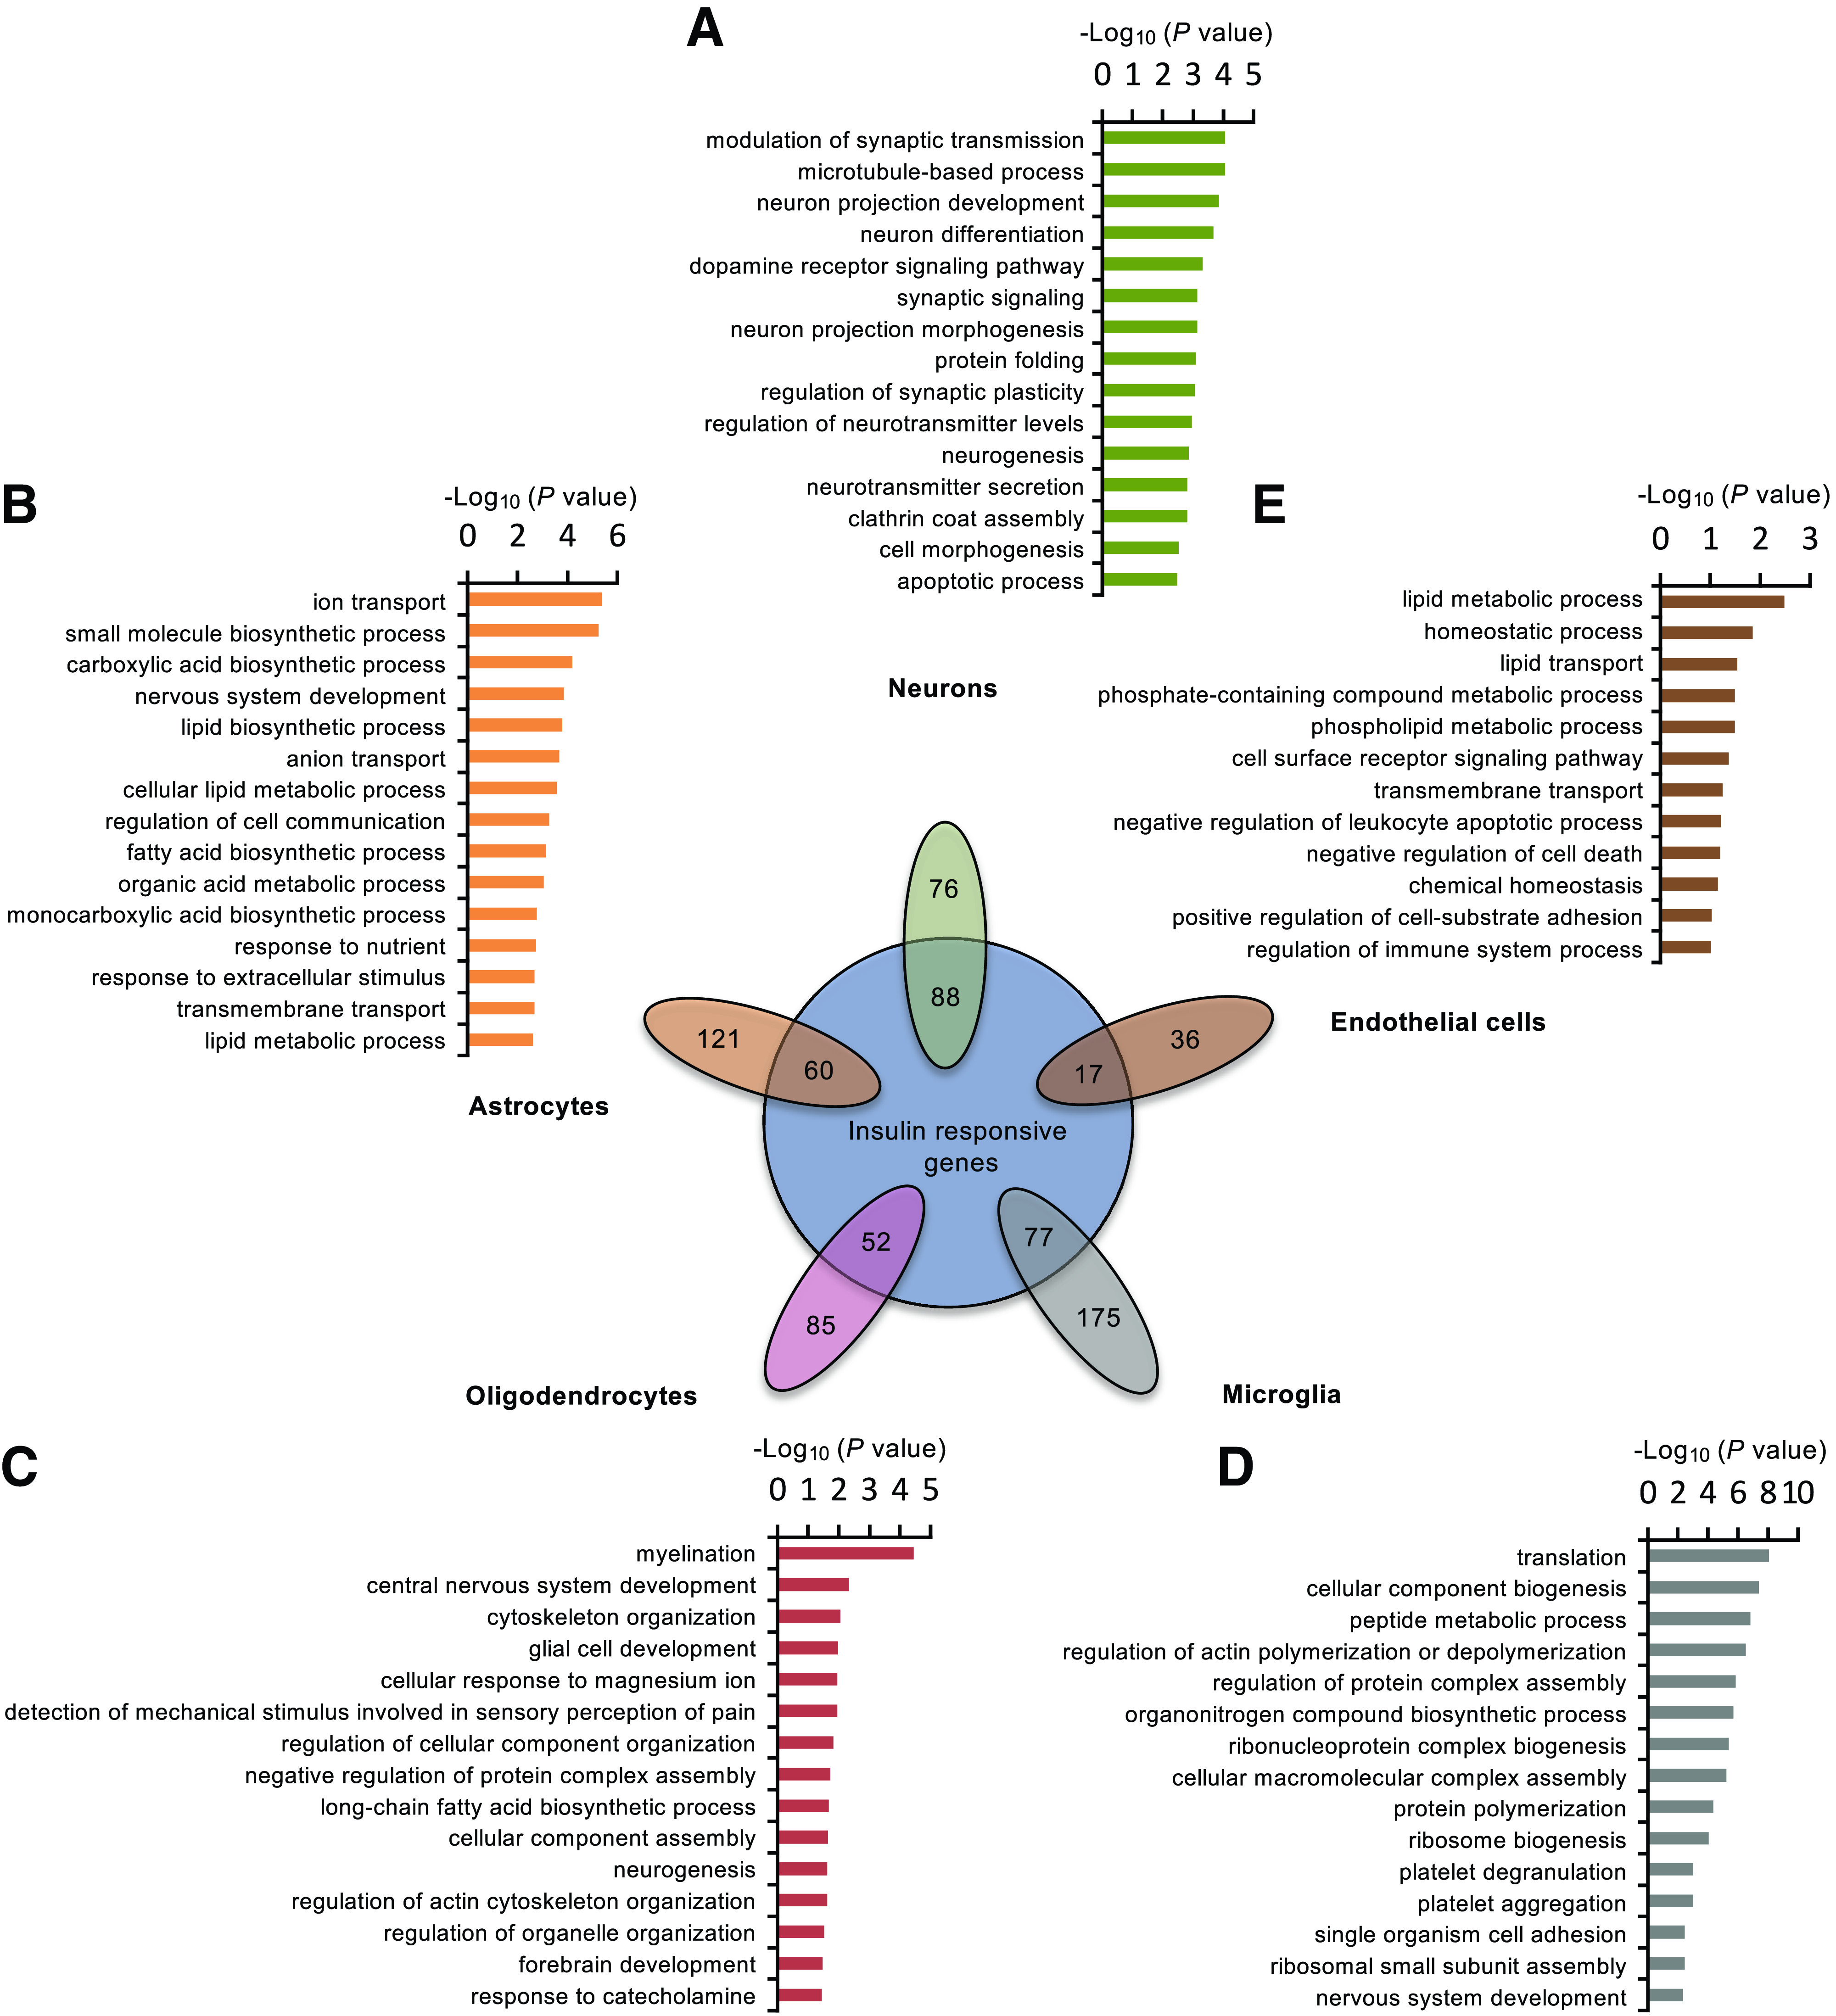
Insulin displays distinct transcriptional effects on populations of neuronal and nonneuronal cells. Venn diagram showing the proportion of cell type–specific genes based on previously performed single-cell RNA-seq (40) that were significantly regulated by low-dose insulin (P < 0.05). The top-enriched GO term FAT pathways from low-dose insulin regulated genes in neurons (A), astrocytes (B), oligodendrocytes (C), microglia (D), and endothelial cells (E) are shown.