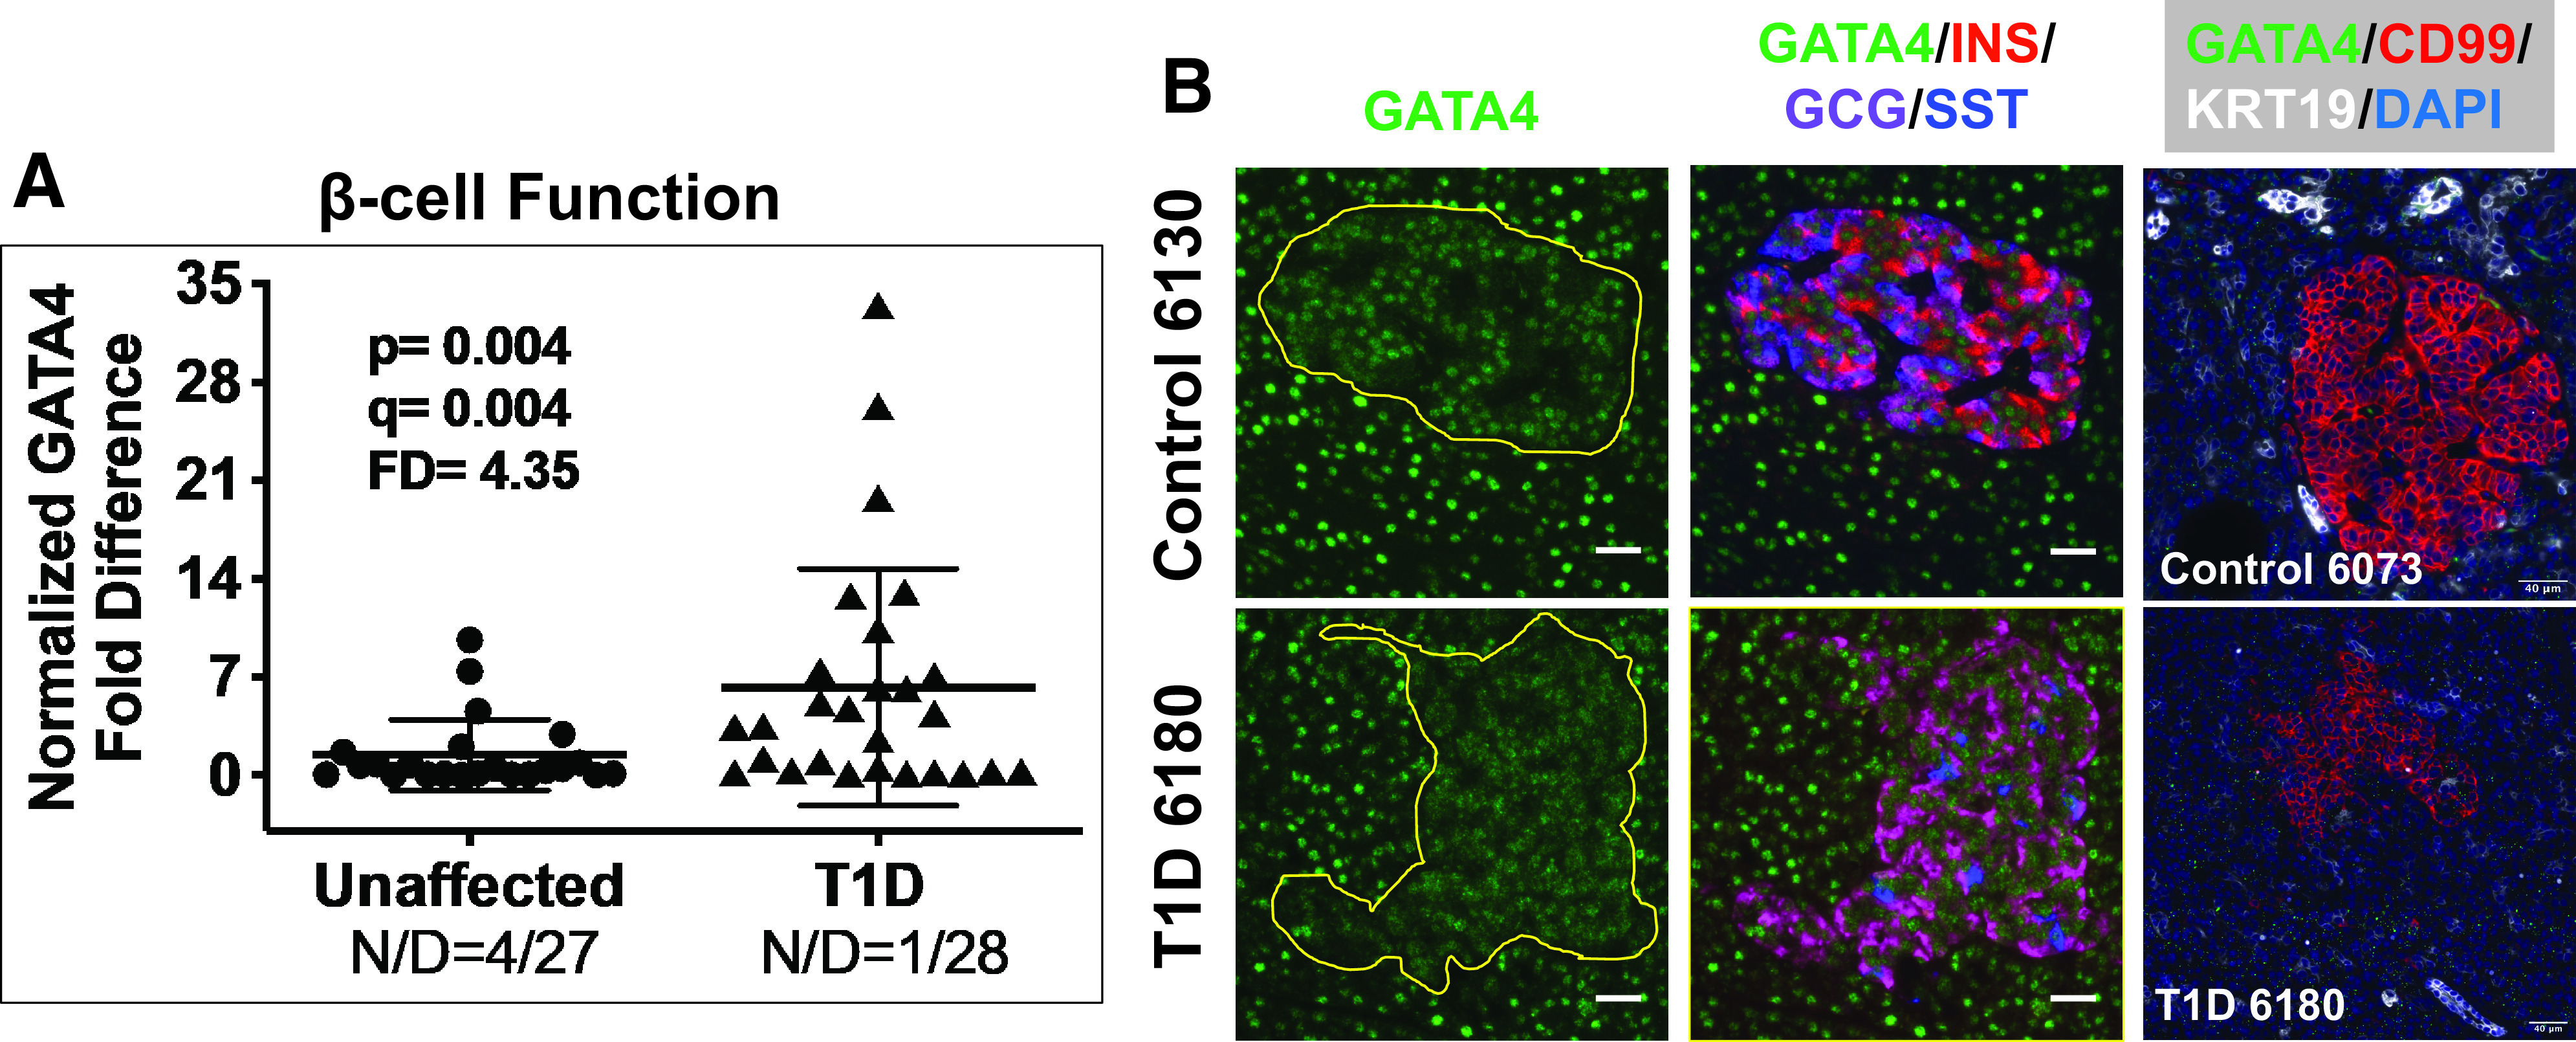
Figure 2.

A: Scatter plot of RTqPCR data depicting expression levels for GATA4, a monogenic diabetes gene in the category β-cell function (Supplementary Table 7). The FD is calculated based on the ratio of the means (Research Design and Methods). See Research Design and Methods for statistical analysis (P values and q values [estimation of false discovery rates]). N/D refers to number (N) of samples yielding no data out of the total (D). B: Widefield IF of GATA4 (green) and overlay with insulin (INS), glucagon (GCG), and somatostatin (SST) from a control and T1D pancreas. Final panel in each row shows combined GATA4 ISH (RNAscope [green dots]) coupled with IF for CD99 and KRT19. Magnification bars = 40 μm.
