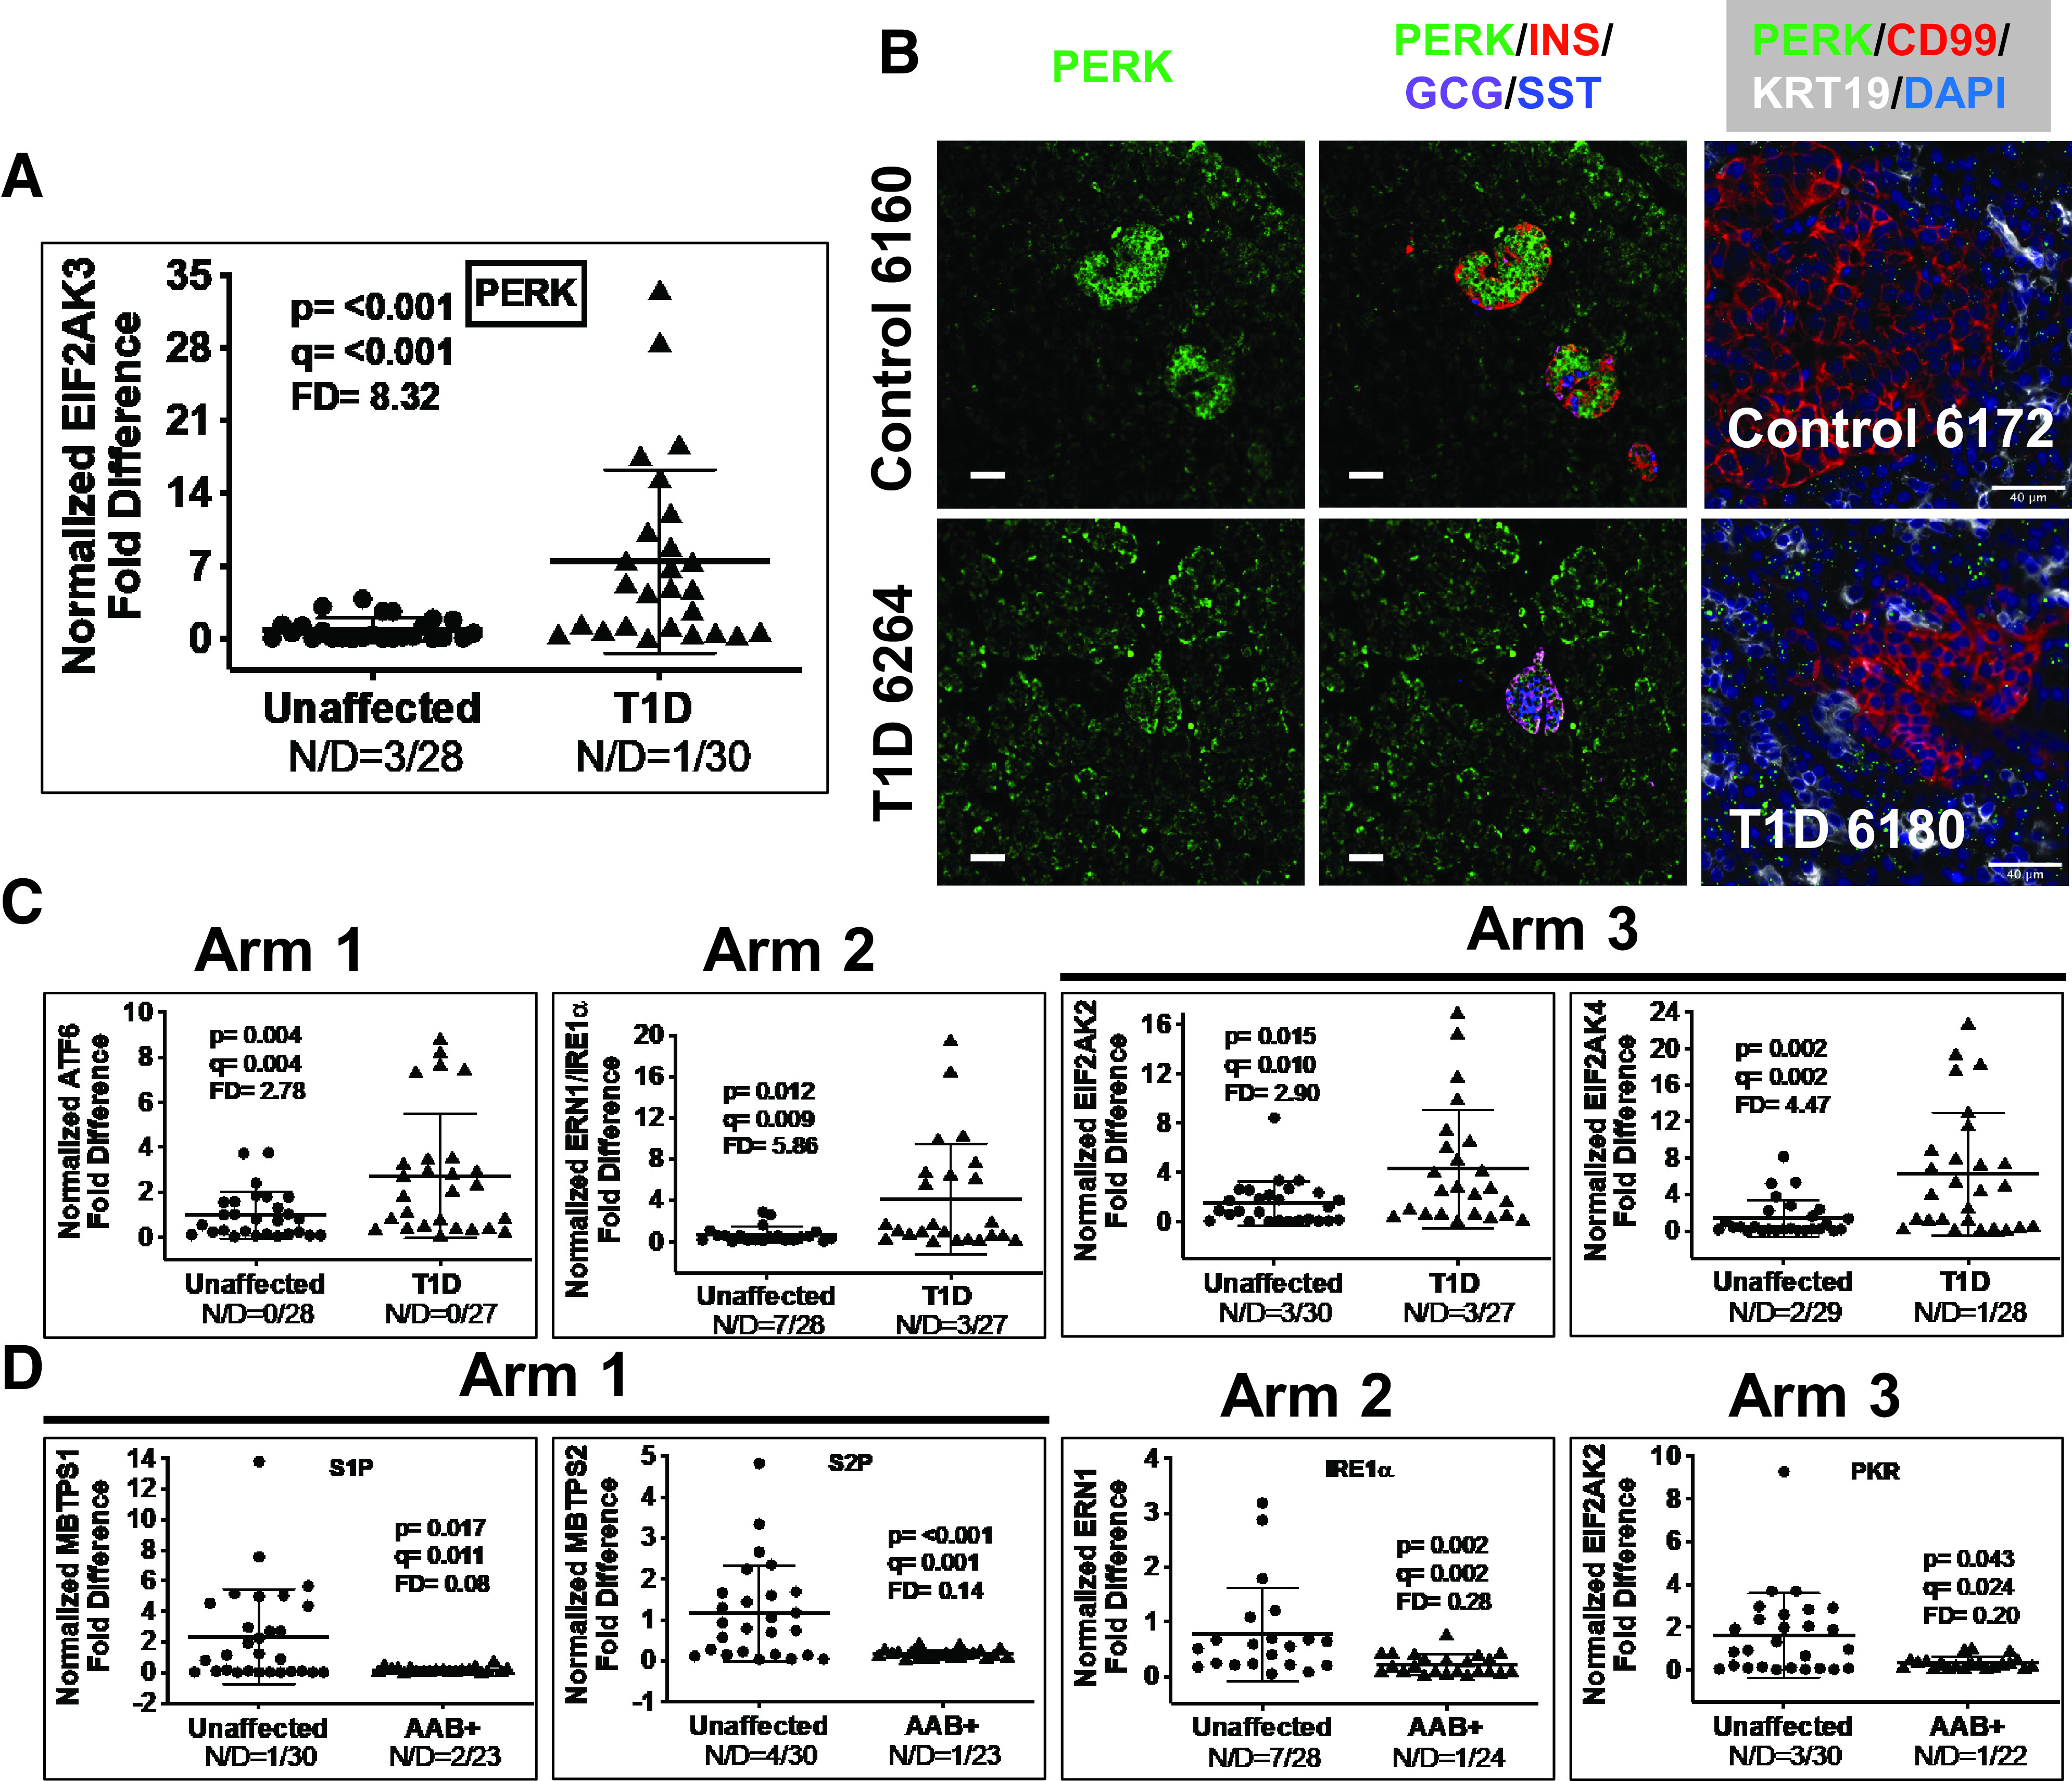
Figure 5.

A: Scatter plot of RTqPCR data depicting expression levels for EIF2AK3/PERK, a representative gene in arm 3 of the ISR. The FD is calculated based on the ratio of the means (Research Design and Methods). See Research Design and Methods for statistical analysis (P values and q values [estimation of false discovery rates]). N/D refers to number (N) of samples yielding no data out of the total (D). B: Widefield IF of PERK (green) and overlay with insulin (INS), glucagon (GCG), and somatostatin (SST) from a control and T1D pancreas. Final panel in each row shows combined PERK ISH (RNAscope [green dots]) coupled with IF for CD99 and KRT19. Magnification bars = 40 μm. C: Scatter plots of RTqPCR data depicting expression levels for ISR genes from the apex of each ISR arm 1–3 in T1D vs. unaffected control pancreata: ATF6, ERN1/IRE1α, EIF2AK2/PKR, EIF2AK3/PERK, and EIF2AK4/GCN2. The FD is calculated based on the ratio of the means. See Research Design and Methods for statistical analysis (P values and q values [estimation of false discovery rates]). D: Scatter plot of RTqPCR data depicting expression levels for genes significantly repressed in autoantibody+ (AAB+) pancreata in each of the three arms of the ISR: MBTPS1/S1P, MBTPS2/S2P, ERN1/IRE1α, and EIF2AK2/PKR.
