Figure 2.

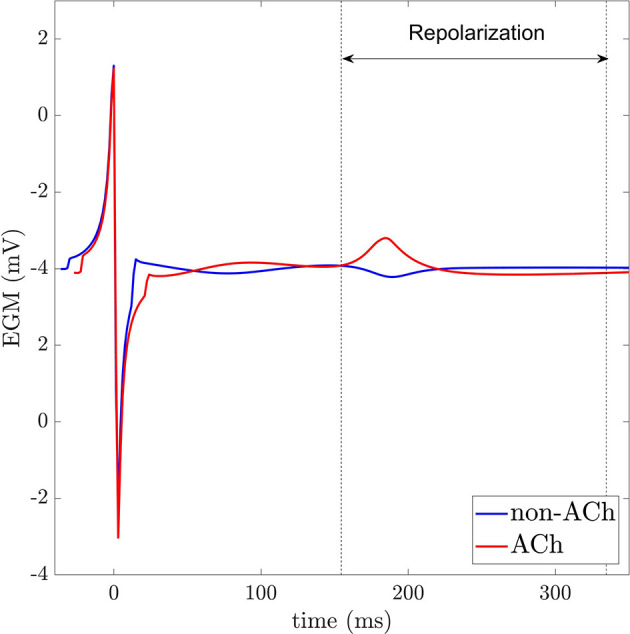
EGMs recorded in non-ACh (blue) and ACh (red) release sites. Dashed vertical lines indicate the repolarization window for analysis.

EGMs recorded in non-ACh (blue) and ACh (red) release sites. Dashed vertical lines indicate the repolarization window for analysis.