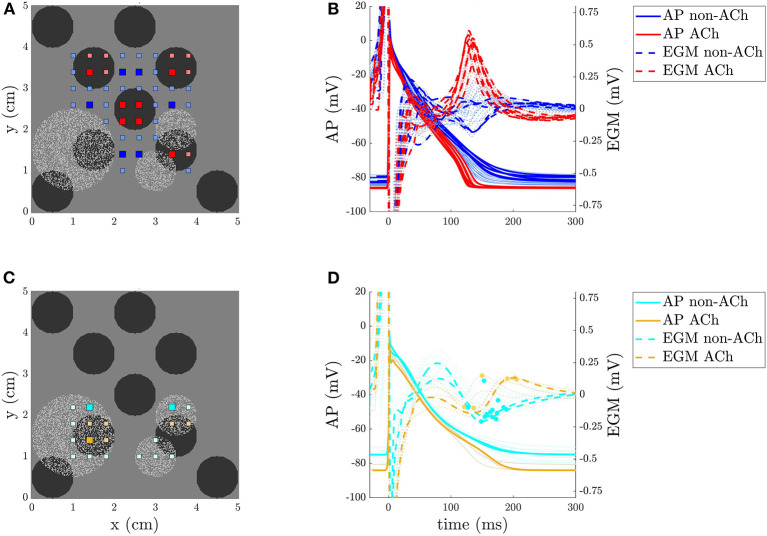
Figure 4.
(A,C) 2D model of a persistent AF (PsAF) tissue with ACh release sites shown in black, fibrosis in light gray, and EGM electrodes in red and blue in the non-fibrotic regions, and in orange and cyan in the fibrotic regions. (B,D) APs and EGMs were recorded in the points represented in the left panels. The thicker lines correspond to the points represented with the big squares in the tissue. In (D) the peaks of the Ri,j(t) waves are highlighted with a dot.

