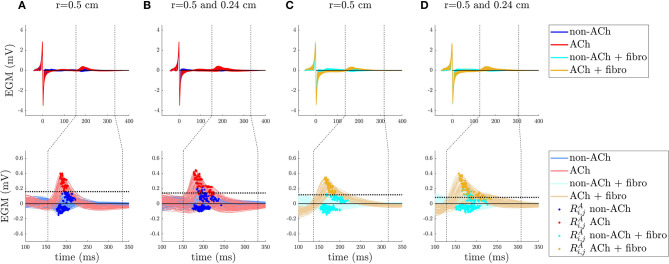
Figure 5.
EGM analysis for a non-AF tissue in (A,B) and a peroxysmal-AF (PxAF) tissue with 20% uniform diffuse fibrosis (Fu) in (C,D). Top row: EGMs aligned with respect to the time correspondent to the maximum slope of the depolarization wave (marked as t = 0 in the x-axis). The vertical dashed lines delimit the time window TW for the Ri,j(t) repolarization signals. Bottom row: atrial repolarization waves, Ri,j(t), with dots indicating the maximum absolute value, , of the waves within TW. The horizontal dotted lines represent the optimal threshold Rth found by Se/Sp analysis.

