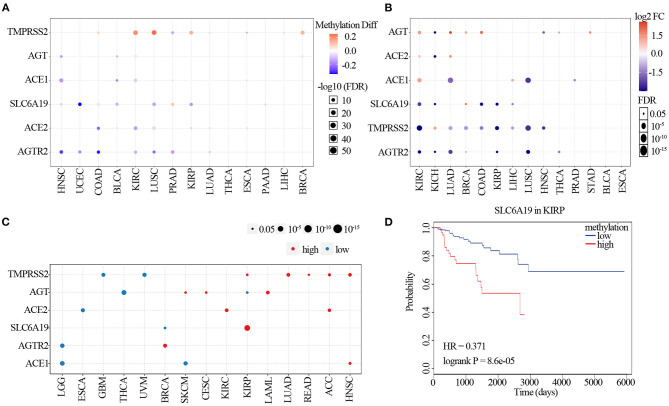
Figure 4.
Methylation of ACE2 receptor-related regulators. (A) Differential methylation changes in ACE2 receptor-related regulators between tumor and normal samples in each cancer. Blue points represent decreased methylation in tumors and red points represent increased methylation in tumors, where the darker the color, the larger the difference in methylation levels. (B) Correlation between methylation and mRNA gene expression. Blue points represent a negative correlation and red points represent a positive correlation, where the darker the color, the higher the correlation. (C) Survival difference between samples with ACE2 receptor-related regulators with high and low methylation. Red points represent poorer survival in high methylation groups; blue points were just the opposite. The size of the point represents the statistical significance, where the larger the dot size, the higher the statistical significance. (D) Survival analysis of SLC6A19 methylation in KIRP.

