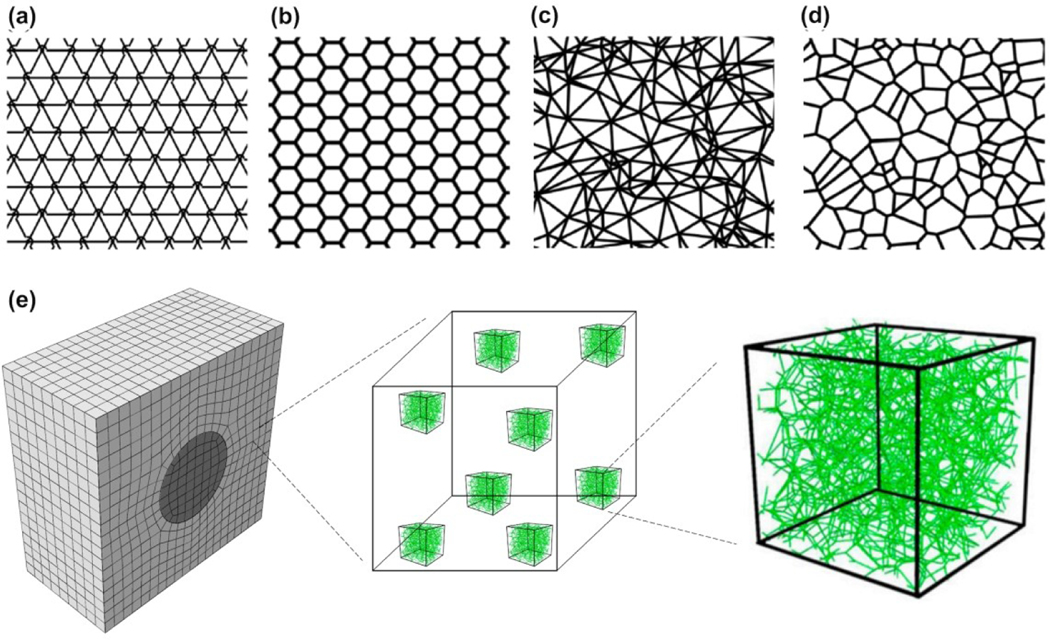
Figure 9.
Different networks for discrete fiber simulations. (a) A triangular lattice network. The arc denotes that one of the three crossing fibers is detached from the cross-link which reduces the local connectivity from 6 to 4. (b) A hexagonal lattice which has a local connectivity of 3. (c) A Delaunay network with a nonuniform local connectivity which has the average local connectivity of 6. (d) A Voronoi network which has a local connectivity of 3.

