
Fig. 1. Kaplan–Meier curve for hospital survival.
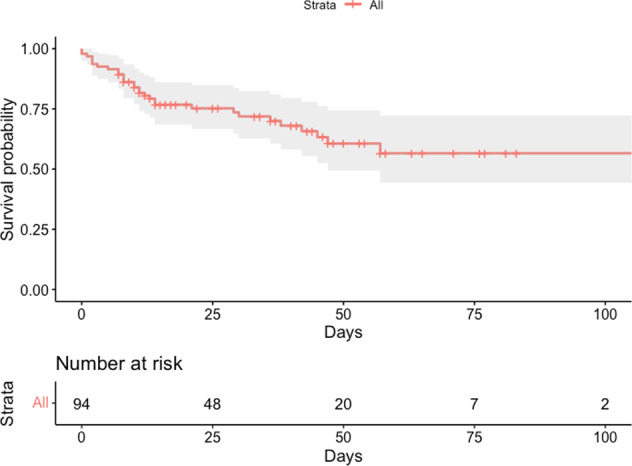
Unadjusted Kaplan–Meier curve of hospital survival probability for the entire cohort (n = 94) until 100 days. 95% confidence intervals illustrated as shaded areas.
Official websites use .gov
A
.gov website belongs to an official
government organization in the United States.
Secure .gov websites use HTTPS
A lock (
) or https:// means you've safely
connected to the .gov website. Share sensitive
information only on official, secure websites.
Unadjusted Kaplan–Meier curve of hospital survival probability for the entire cohort (n = 94) until 100 days. 95% confidence intervals illustrated as shaded areas.