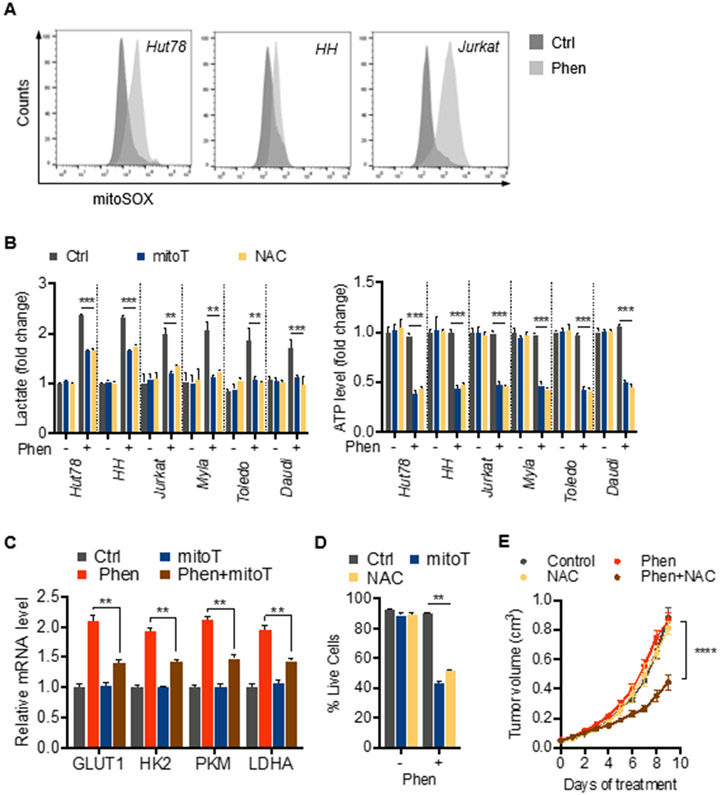
Figure 2. Mitochondrial ROS promote metabolic adaption and survival during exposure to phenformin.
(A) Mitochondrial ROS levels detected by mitoSOX Red fluorescence after treatment with 10 μM phenformin for 24 hrs (representative histograms).
(B) Effect of antioxidants, 4 mM N-acetylcysteine (NAC) and 30 μM mitoTEMPO (mitoT), on lactate production and intracellular ATP levels after exposure to 10 μM phenformin for 24 hrs.
(C) Effect of antioxidant mitoTEMPO (mitoT) on levels of mRNA of key glycolytic proteins after 24 hours of treatment with 10 μM phenformin (Phen).
(D) Cell viability in response to 10 μM phenformin in presence and absence of antioxidants, NAC and mitoTEMPO.
(E) Effect of phenformin (100 mg/kg body weight) and/or NAC (1 g/L in drinking water) on Hut78 xenograft tumor growth. Data presented as mean ± SD, n=4 tumors per group. All other data presented as mean ± SD of at least triplicate measurements.

