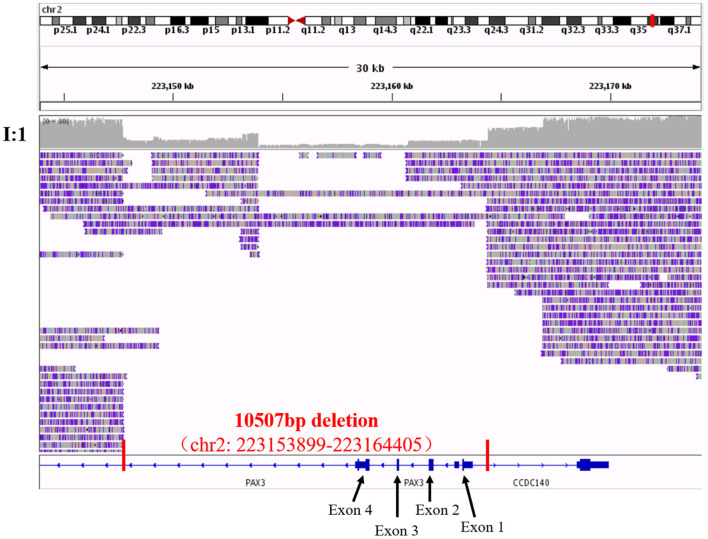
Figure 3.
The visualization of third-generation sequencing result of Chr2: 223143899-223174405 in I:1 by IGV software. Red vertical lines cut out the region of the structural variant, and red words exhibited the details of this structural variant. Black arrows and words point out the exons of PAX3 in the region.

