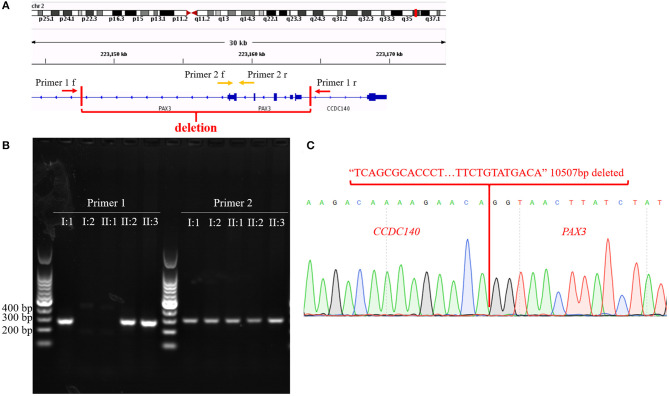
Figure 4.
(A) The diagram of primer 1/2 pairs design. Arrows represent primer pairs; red vertical lines cut out the region of the structural variant. (B) Agarose gel electrophoresis results. (C) Sequencing results of sequences amplified according to Primer 1. Red sequence represents deleted sequence; red words indicate genes that correspond to the sequences.

