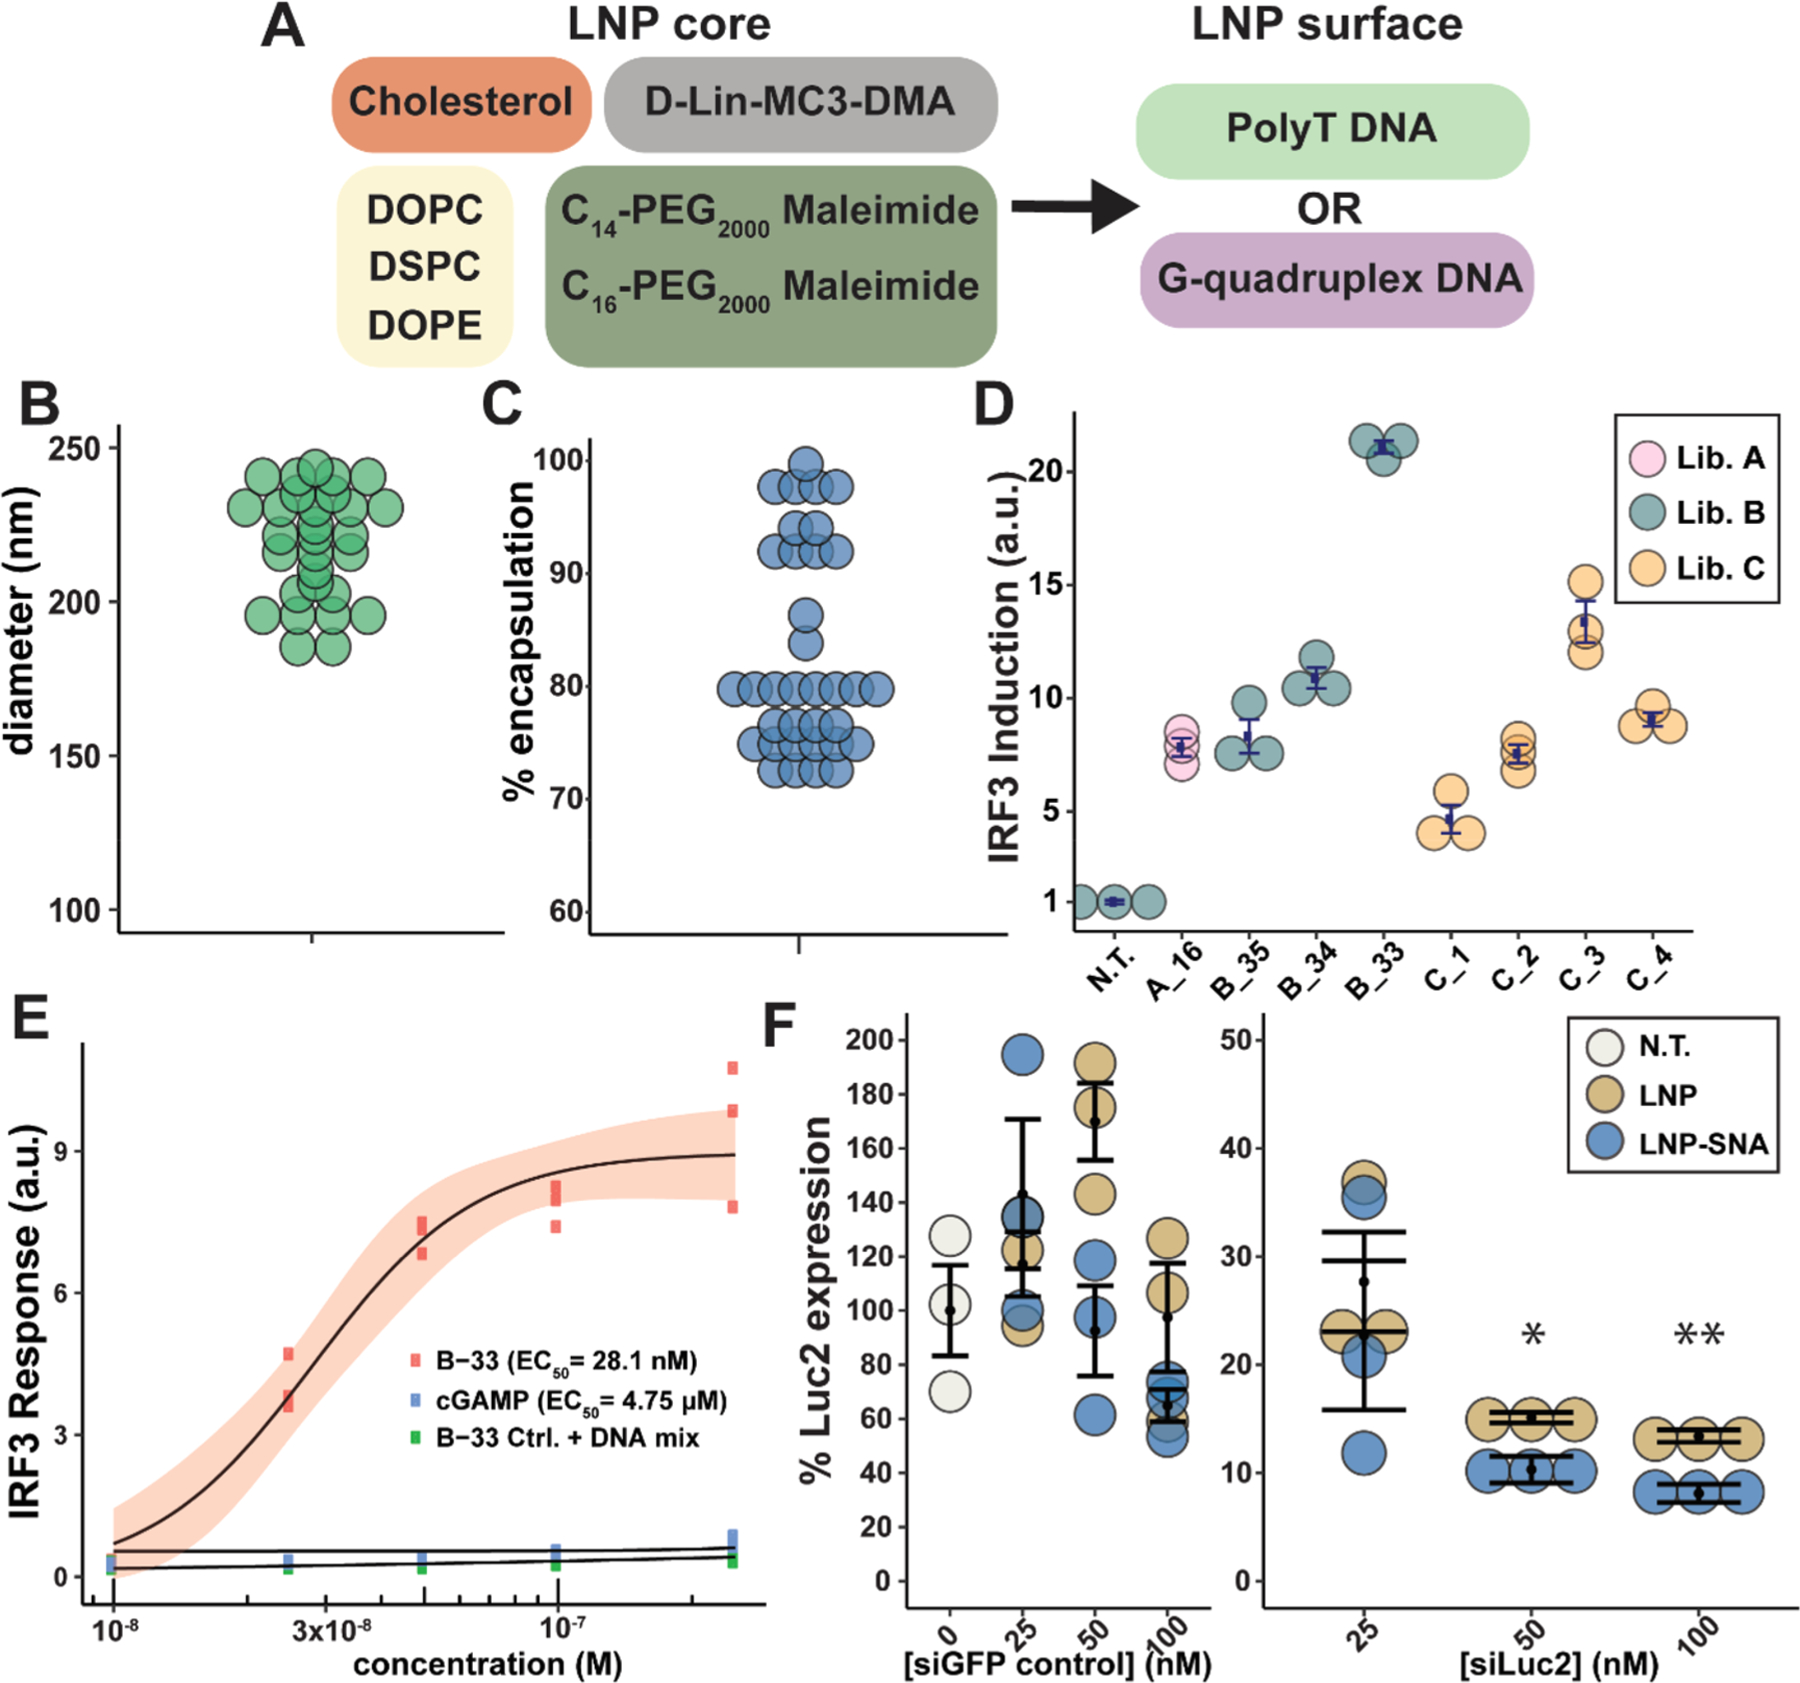
Figure 2.

DoE optimization process improves DNA and RNA delivery in vitro. (A) Core compositions and surface DNA sequences used in library B. (B) Diameter of library B LNPs. (C) Encapsulation efficiency of LNP-SNAs in library B. (D) IRF3 induction measured in a RAW 264.7-Lucia ISG cell line of candidates in libraries A–C normalized to untreated samples (error bars represent s.e.m., n = 3 biologically independent replicates). (E) IRF3 induction of B-33 LNP-SNA, 2′3′-cGAMP, and B-33 LNP-SNA mixed with free dsDNA (the red ribbon represents 95% C.I., n = 3 biologically independent replicates). (F) U87-Luc2 cells were treated for 24 h with LNPs or LNP-SNAs encapsulating a siGFP control sequence or a siLuc2 targeting sequence (error bars represent s.e.m., n = 3 biologically independent replicates, one-tailed t test comparing LNP and LNP-SNA, * = p ≤ 0.05, and ** = p ≤ 0.01).
