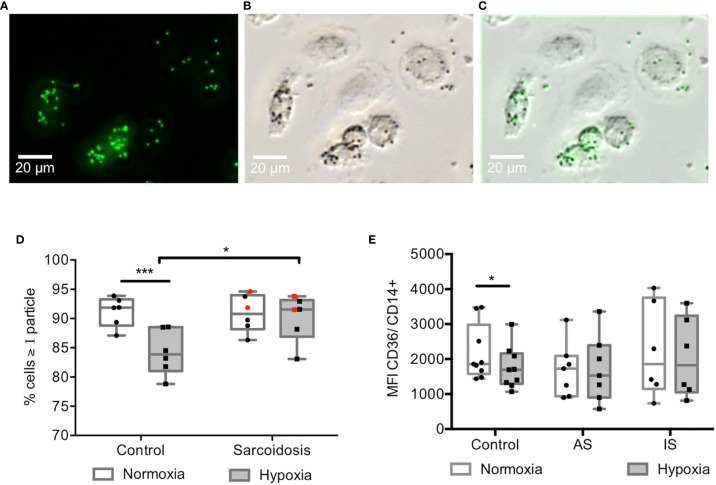
Figure 2.
Hypoxia impaired phagocytosis in controls but not in sarcoidosis MD-macrophages. (A–C) Representative image of MD-macrophages exposed to normoxia from high active sarcoidosis after 30 min incubation with fluospheres (1µm) followed by four PBS washes (magnification x 200); (A) fluorescent 1µm fluospheres (green) (B), phase-contrast images of MD-macrophages (C), overlay images showing fluospheres within MD-macrophages. (D) Effect of hypoxia on phagocytosis in controls and sarcoidosis patients estimated by the ratio of cells with at least one particle and the total number of cells. Each point indicates a patient and/or control (n=6/group). In sarcoidosis group, black dots represent high active sarcoidosis (AS), and red dots low active or inactive sarcoidosis (IS); (E) Effect of hypoxia on the CD36 scavenger receptor expression in controls, AS, IS; analyzed by flow cytometry of CD14+ MD-macrophages. The results are expressed as the mean CD36 fluorescence intensity (MFI). Each point indicates a patient and/or control (n= 6-9/group). Results are expressed as box plot showing 25th and 75th percentile and median *p < 0.05; ***p < 0.001 in two-way ANOVA-repeated measures with Sidak post-hoc test.

