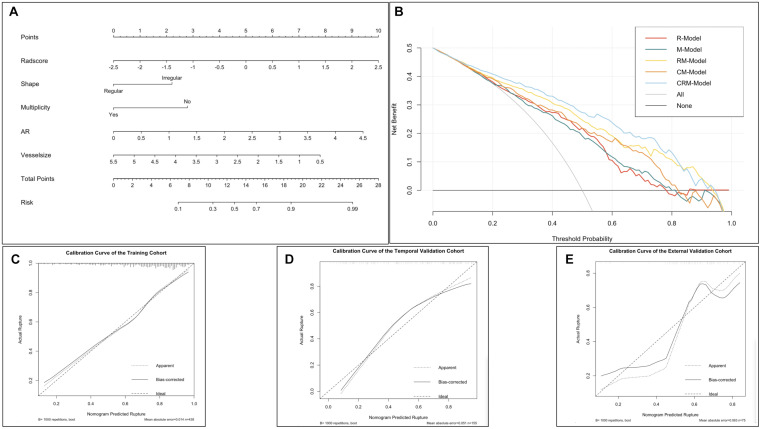
FIGURE 3.
The comprehensive nomogram for classifying ruptured MCA aneurysm and decision curve analysis in the overall patients. (A) The comprehensive nomogram for predicting aneurysm rupture. (B) Decision curve analysis in overall patients. The y-axis indicates the net benefit; the x-axis indicates threshold probability. The gray line represents the assumption that all aneurysms rupture. The black line represents the assumption that no aneurysm ruptures. The red line, green line, gold line, orange line, and blue line represent the net benefit of the radiomics model (R-model), morphological model (M-model), radiomics-morphological model (RM-model), clinical-morphological model (CM-model), and clinical-radiomics-morphological model (CRM-model), respectively. Calibration of the nomogram in the training (C), temporal validation (D), and external validation datasets (E).

