Fig. 1.
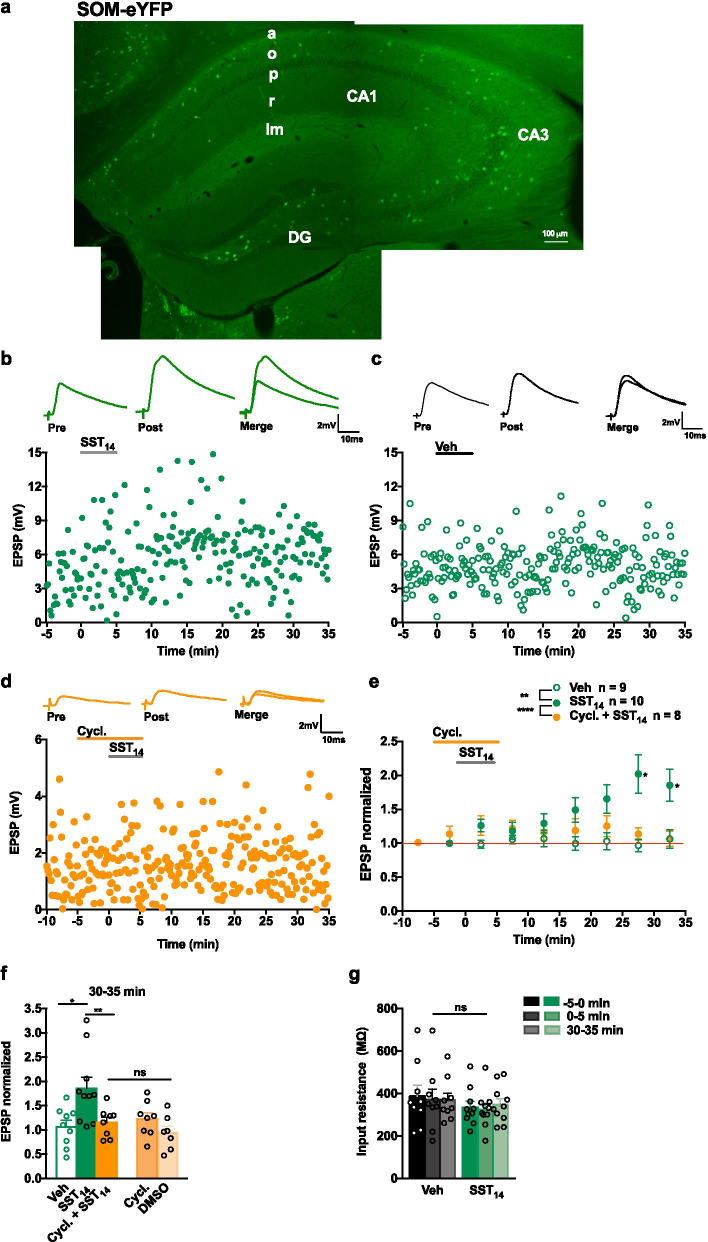
SST14 induces a long-term potentiation of EPSPs in SOM-INs via SSTRs. a Fluorescence images showing eYFP expression in SOM-INs in hippocampus of SOM-eYFP mouse. b–d Current clamp recording of EPSPs (top) and time plots of EPSP amplitude from representative cells receiving 5 µM SST14 (b), vehicle (c) or SST14 in the presence of 1 µM of the SST1-5R antagonist cyclosomatostatin (cycl. + SST14) (d). EPSPs are average for − 5 to 0 min baseline (pre) and 30 to 35 min after application (post). e Summary time plots of EPSPs (normalized to baseline), showing potentiation of EPSPs after SST14 application (filled green circle), prevented by co-application of the SST1-5R antagonist cyclosomatostatin (filled orange square), and lack of effect of vehicle application (open green circle). For SST14 group, n = 10 cells and 9 mice, rmANOVA, Dunnett’s multiple comparisons (25–30 min p = 0.025, 30–35 min p = 0.023). For vehicle group, n = 9 cells and 6 mice, rmANOVA p = 0.864. For cyclostomatostatin + SST14 group, n = 8 cells and 5 mice, rmANOVA p = 0.382. f Summary bar graph of EPSP amplitude at 30–35 min after application, showing long-term potentiation after SST14, and no effect after either SST14 with SST1-5R antagonist, vehicle, cyclosomatostatin alone, or DMSO (vehicle for cyclosomatostatin) (Veh vs SST14 group, two-way mixed ANOVA, univariate analysis at 30–35 min p = 0.010; SST14 vs Cycl. + SST14 group, two-way mixed ANOVA, univariate analysis at 30–35 min p = 0.002; Cycl. + SST14 vs Cycl. and vs DMSO group, two-way mixed ANOVA p = 0.602). g Summary bar graph showing no change in cell input resistance before (− 5–0 min), during (0–5 min) and after (30–35 min) vehicle or SST14 application. Two-way mixed ANOVA, p = 0.554. *p < 0.05; **p < 0.01; ns not significant

