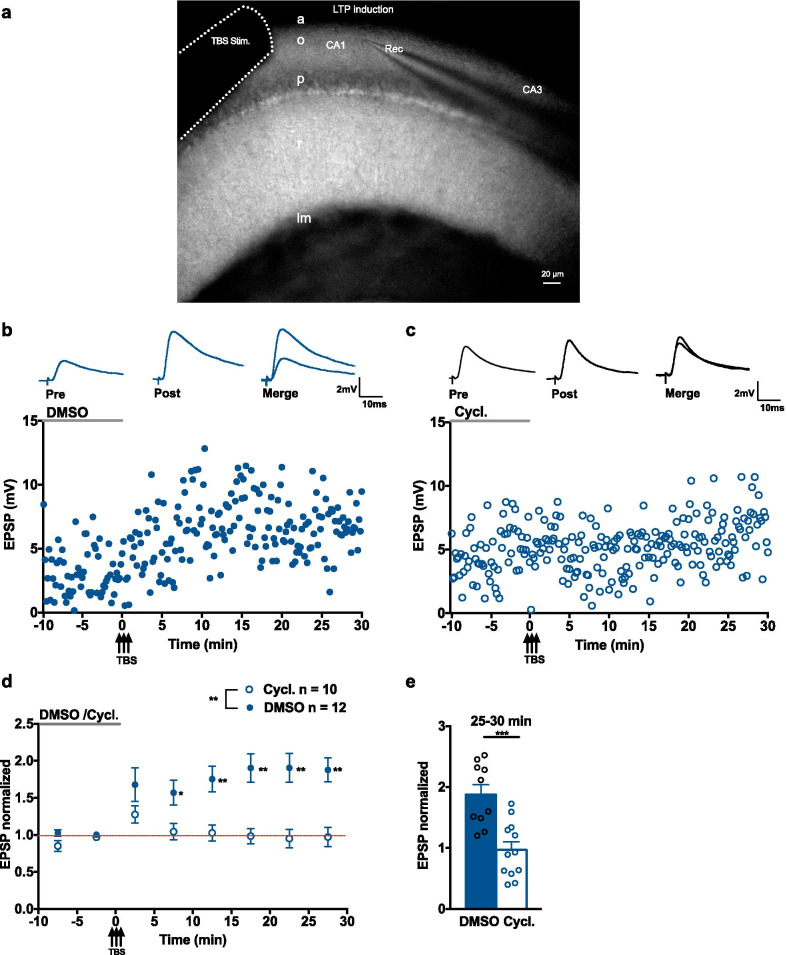
Fig. 2.
SST1-5R antagonist cyclosomatostatin prevents Hebbian LTP. a Image showing microelectrodes configuration for stimulation and recording during TBS-induced LTP experiments. b, c Current clamp recording of EPSPs (top) and time plots of EPSP amplitude from representative cells receiving TBS in the presence of DMSO (0.01%) (b) or the SST1-5R antagonist cyclosomatostatin (1 µM) (c). d Summary time plots of EPSPs (normalized to baseline), showing that TBS in the presence of DMSO induces LTP of EPSPs (filled blue circle), but TBS in the presence of cyclosomatostatin does not (open blue circle). For DMSO group, n = 10 cells and 6 mice, rmANOVA, Dunnett’s multiple comparisons (5–10 min p = 0.040, 10–15 min p = 0.009, 15–20 min p = 0.006, 20–25 min p = 0.006, 25–30 min p = 0.002). For cyclosomatostatin group, n = 12 cells and 6 mice, rmANOVA, p = 0.124. e Summary bar graph of EPSP amplitude at 25–30 min after TBS showing LTP in DMSO but not in cyclosomatostatin. Two-way mixed ANOVA with univariate analysis of variance, 25–30 min p = 0.0003. *p < 0.05; **p < 0.01; ***p < 0.001; ns not significant

