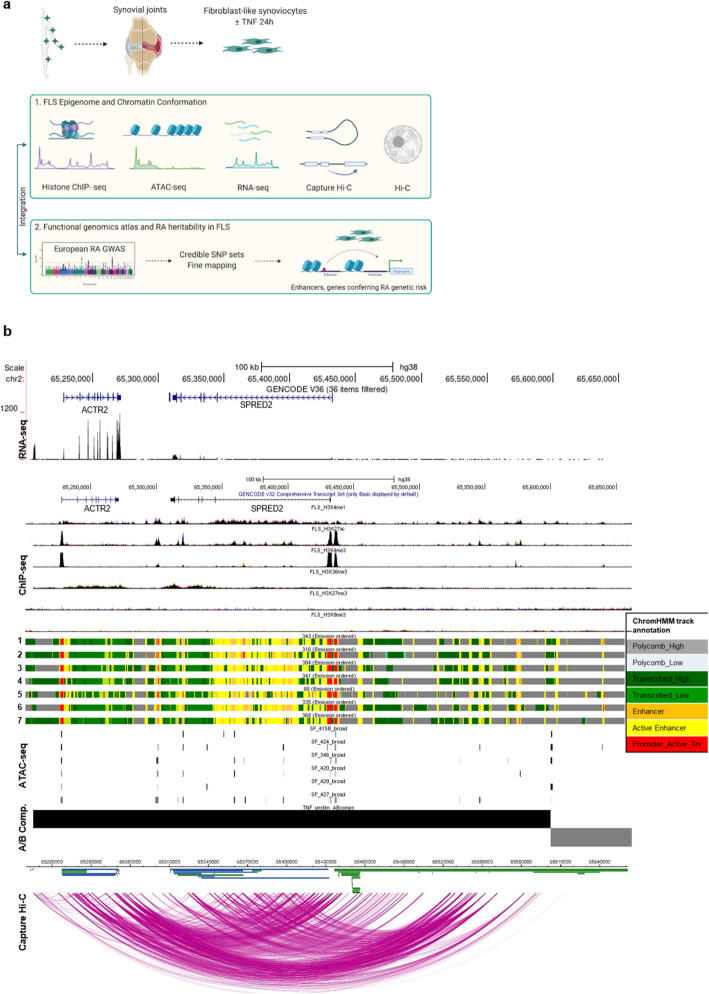
Fig. 1.
Epigenomic and 3D chromatin atlas of human FLS. a Schematic representation of the workflow to comprehensively annotate the transcriptome, epigenome, and chromatin structure of FLS and define their contribution to RA heritability. This figure was created using BioRender. b The SPRED2 locus as an example genomic region demonstrating the annotation of epigenetic states and chromatin architecture in unstimulated FLS. Shown are from top to bottom, one exemplary RNA-seq track, ChIP-seq peaks (H3K4me1, H3K27ac, H3K4me3, H3K36me3, H3K27me3, H3K9me3), ChromHMM annotation in 7 different FLS lines (1: OA hand FLS, 2: RA hand FLS, 3: OA shoulder FLS, 4: RA shoulder FLS, 5: healthy knee FLS, 6: OA knee FLS, 7: RA knee FLS), ATAC-seq peaks in 6 different RA FLS lines, A/B compartments (black bar open chromatin, gray bar closed chromatin), chromatin interactions (Capture HiC)

