Fig. 3.
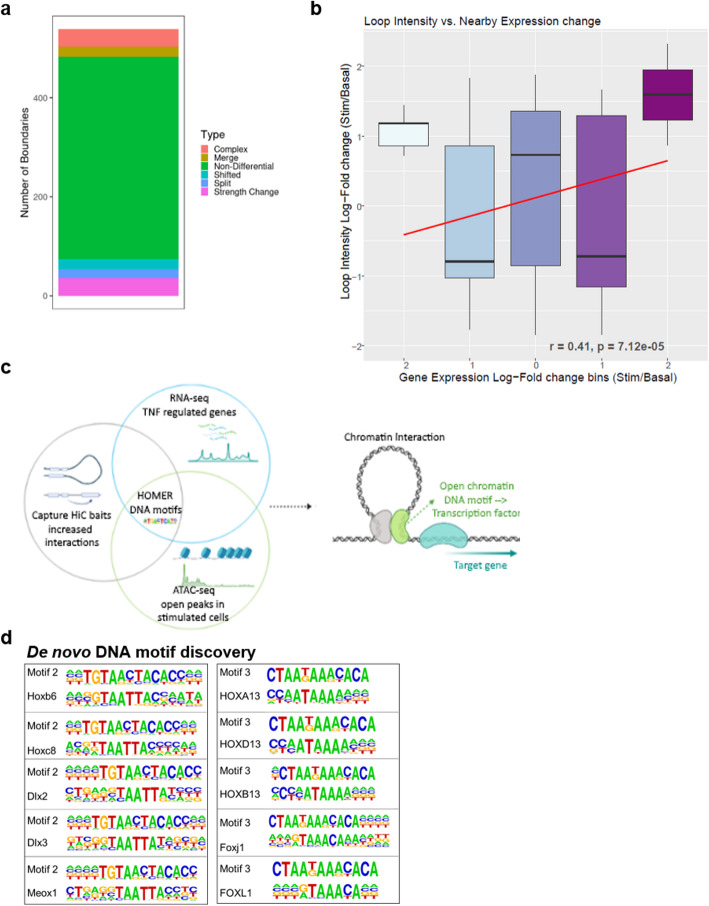
Effect of TNF stimulation on the chromatin landscape in FLS. a Comparison of TADs boundaries between basal and TNF-stimulated FLS by TADCompare. Number of non-differential (green) and differential TAD boundaries is shown. Differential TAD boundaries are classified as boundary position changes (complex, merge, shifted, split) or strength change (differential boundary magnitude). Complex, merged, and split boundary changes represent the most disruptive changes of the 3D structure of the genome. b Pearson correlation of the loop intensity as determined by CHiC with change in the expression of nearby genes (log fold change). Negative numbers in the x-axis indicate downregulation, positive numbers upregulation of gene expression. c Graphical representation of the RNA-seq, ATAC-seq, and CHiC data integration to identify transcription factor binding sites in TNF-stimulated FLS. This figure was created using BioRender. d De novo DNA motif discovery identified two motifs (motif 2 and motif 3) with high similarity to the binding sites of homeobox (TAATTA) and forkhead box transcription factors (TAAA) in the dataset with TNF-repressed genes.

