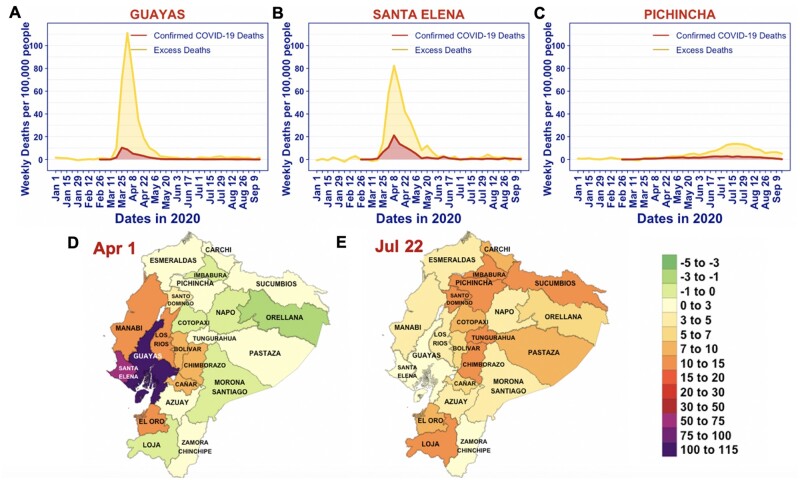
Figure 4.
The spatial and temporal patterns of excess deaths in 2020 in Ecuador. (A–C) Time series for excess deaths (yellow; lighter colour) and documented COVID-19 deaths (red; darker colour) per 100 000 people in Guayas, Santa Elena and Pichincha. (D and E) Provincial maps of Ecuador showing the number of excess deaths per 100 000 people (colour) during the weeks of 1–7 April (panel D) and 22–28 July 2020 (panel E )

