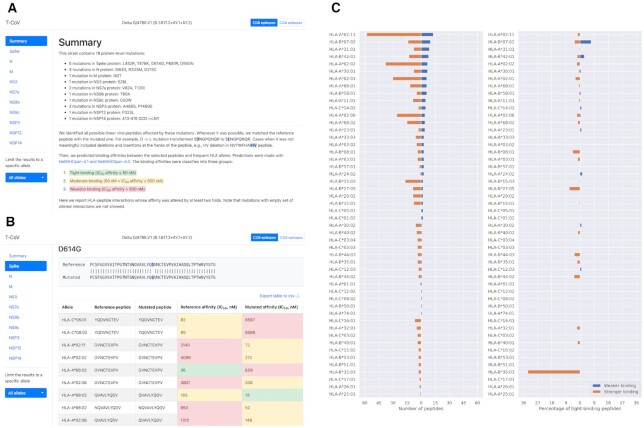
Figure 1.
The web interface of T-CoV. (A) Top part of the page contains SARS-CoV-2 variant name, list of protein-level mutations, short introduction and two navigation panels: through viral proteins and different HLA alleles. (B) A single mutation analysis includes a fragment of pairwise sequence alignment (the reference variant and the variant of consideration) and a table with HLA-peptide interactions significantly affected by the analyzed mutation. (C) Allele-specific differences between numbers of T-cell epitopes from the reference virus and the variant of consideration (plot was constructed for the Delta variant). Left panel stands for the absolute number of peptides, while the right panel represents percentage of tight HLA-peptide interactions (absolute number relative to the number of tight-binders in the reference immunopeptidome).

