
Fig. 2. Irx3 acts in the brain to regulate metabolism and changes in macronutrient selection.
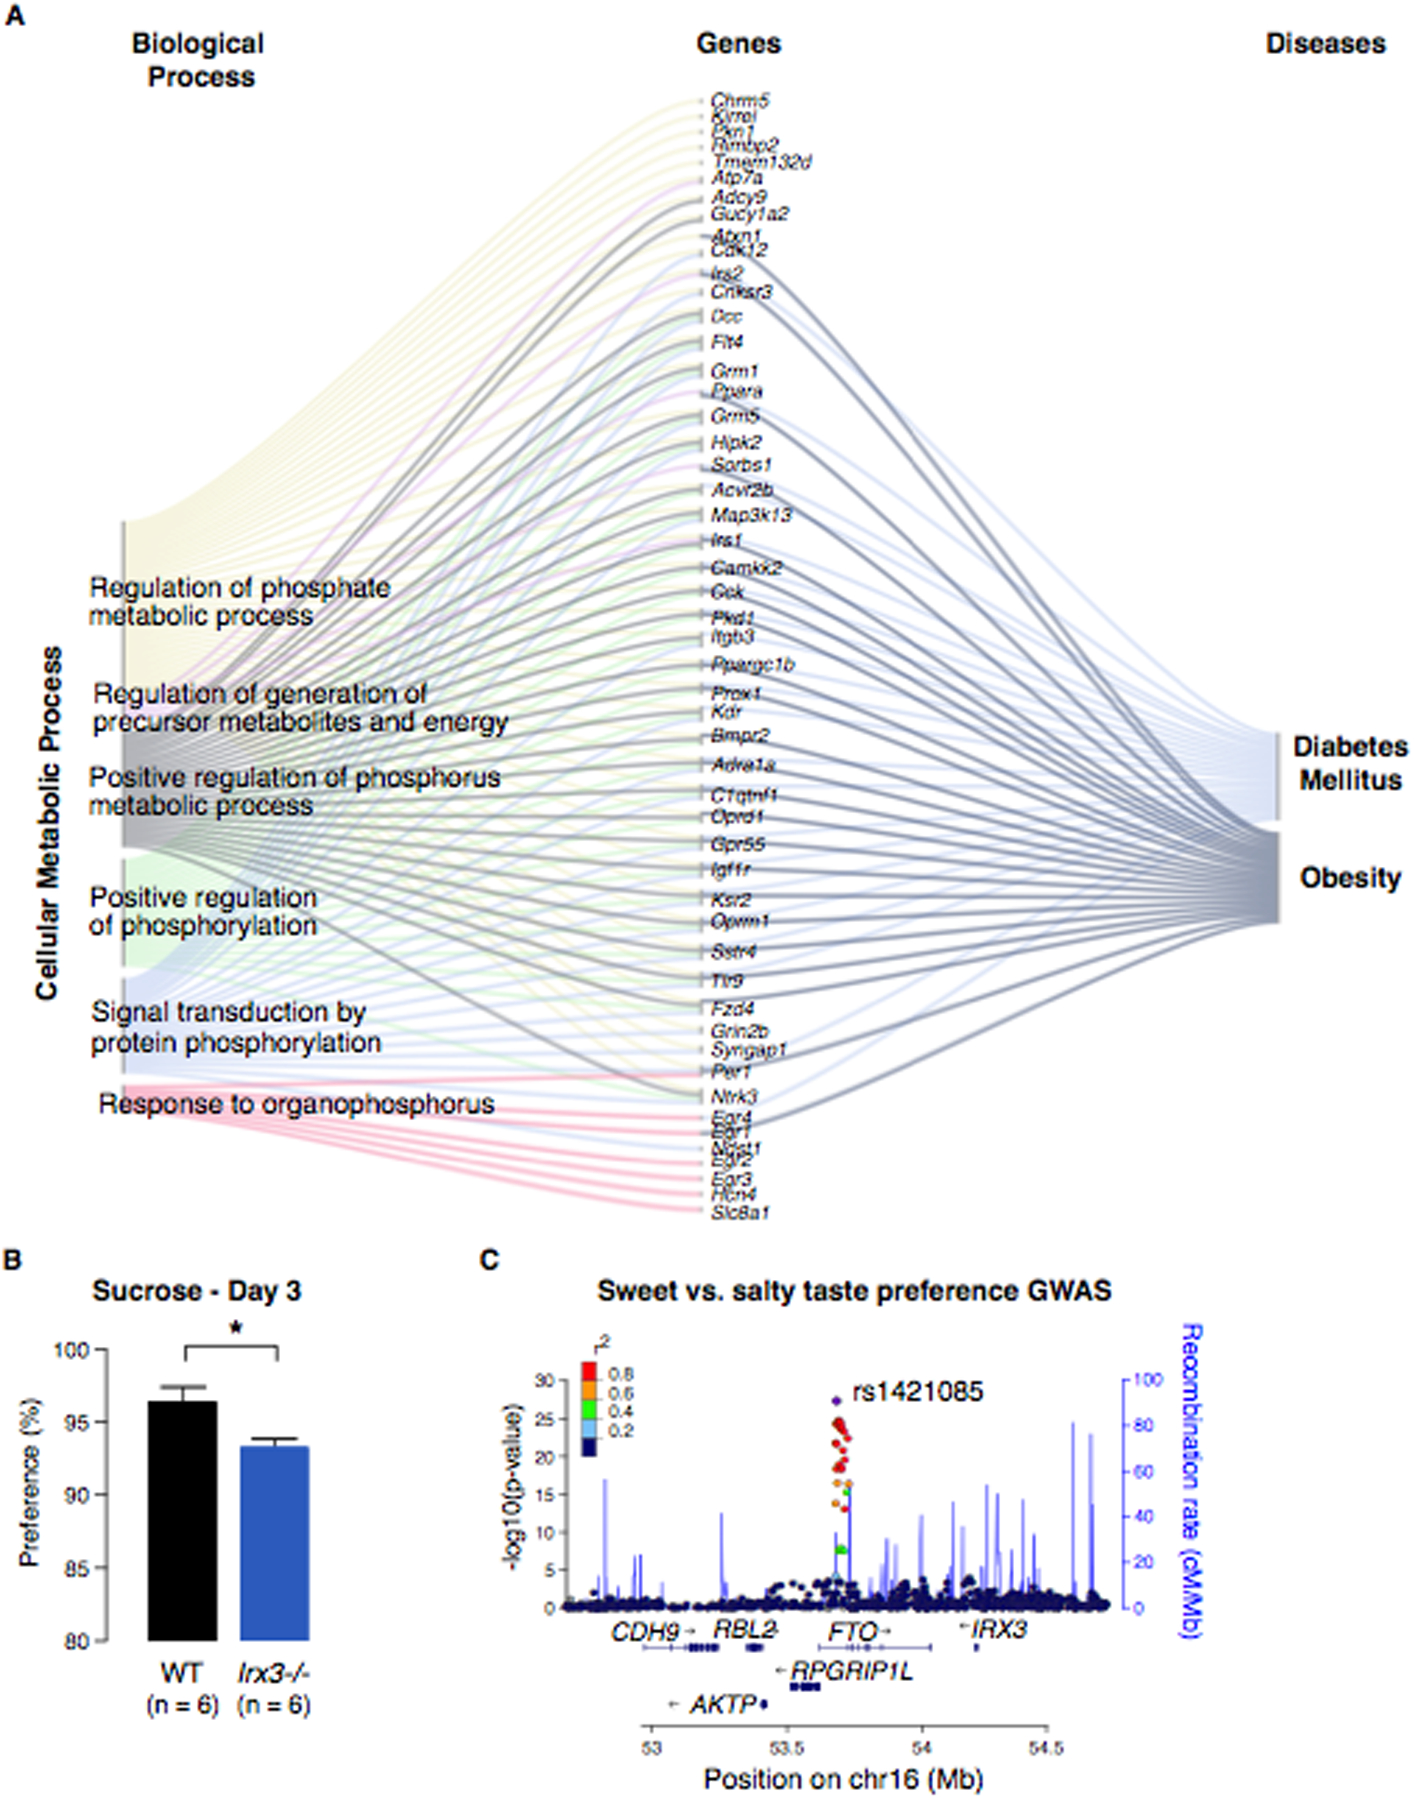
(A) Expression analysis of differentially expressed genes between hypothalami of Irx3−/− and WT mice using Gene Ontology (GO) annotations. Sankey flow diagram showing all genes upregulated in the hypothalami from Irx3−/− animals with high enrichment for Cellular Metabolic Processes and the top ranked diseases related to them. Gene symbols are shown. (B) Two-bottle choice experiment comparing Irx3−/− and WT mice. Data are expressed as mean ± SEM. *P < 0.05 compared to WT group. Error bars represent standard deviations. (C) A regional association plot of the FTO locus. LocusZoom was used to plot the negative log10 p-value of every SNP within +/− 700 kb of rs1421085, the lead SNP in the locus.