
Fig. 4. Evaluation of enhancer activity in the FTO obesity-associated locus in neuronal and adipose tissues.
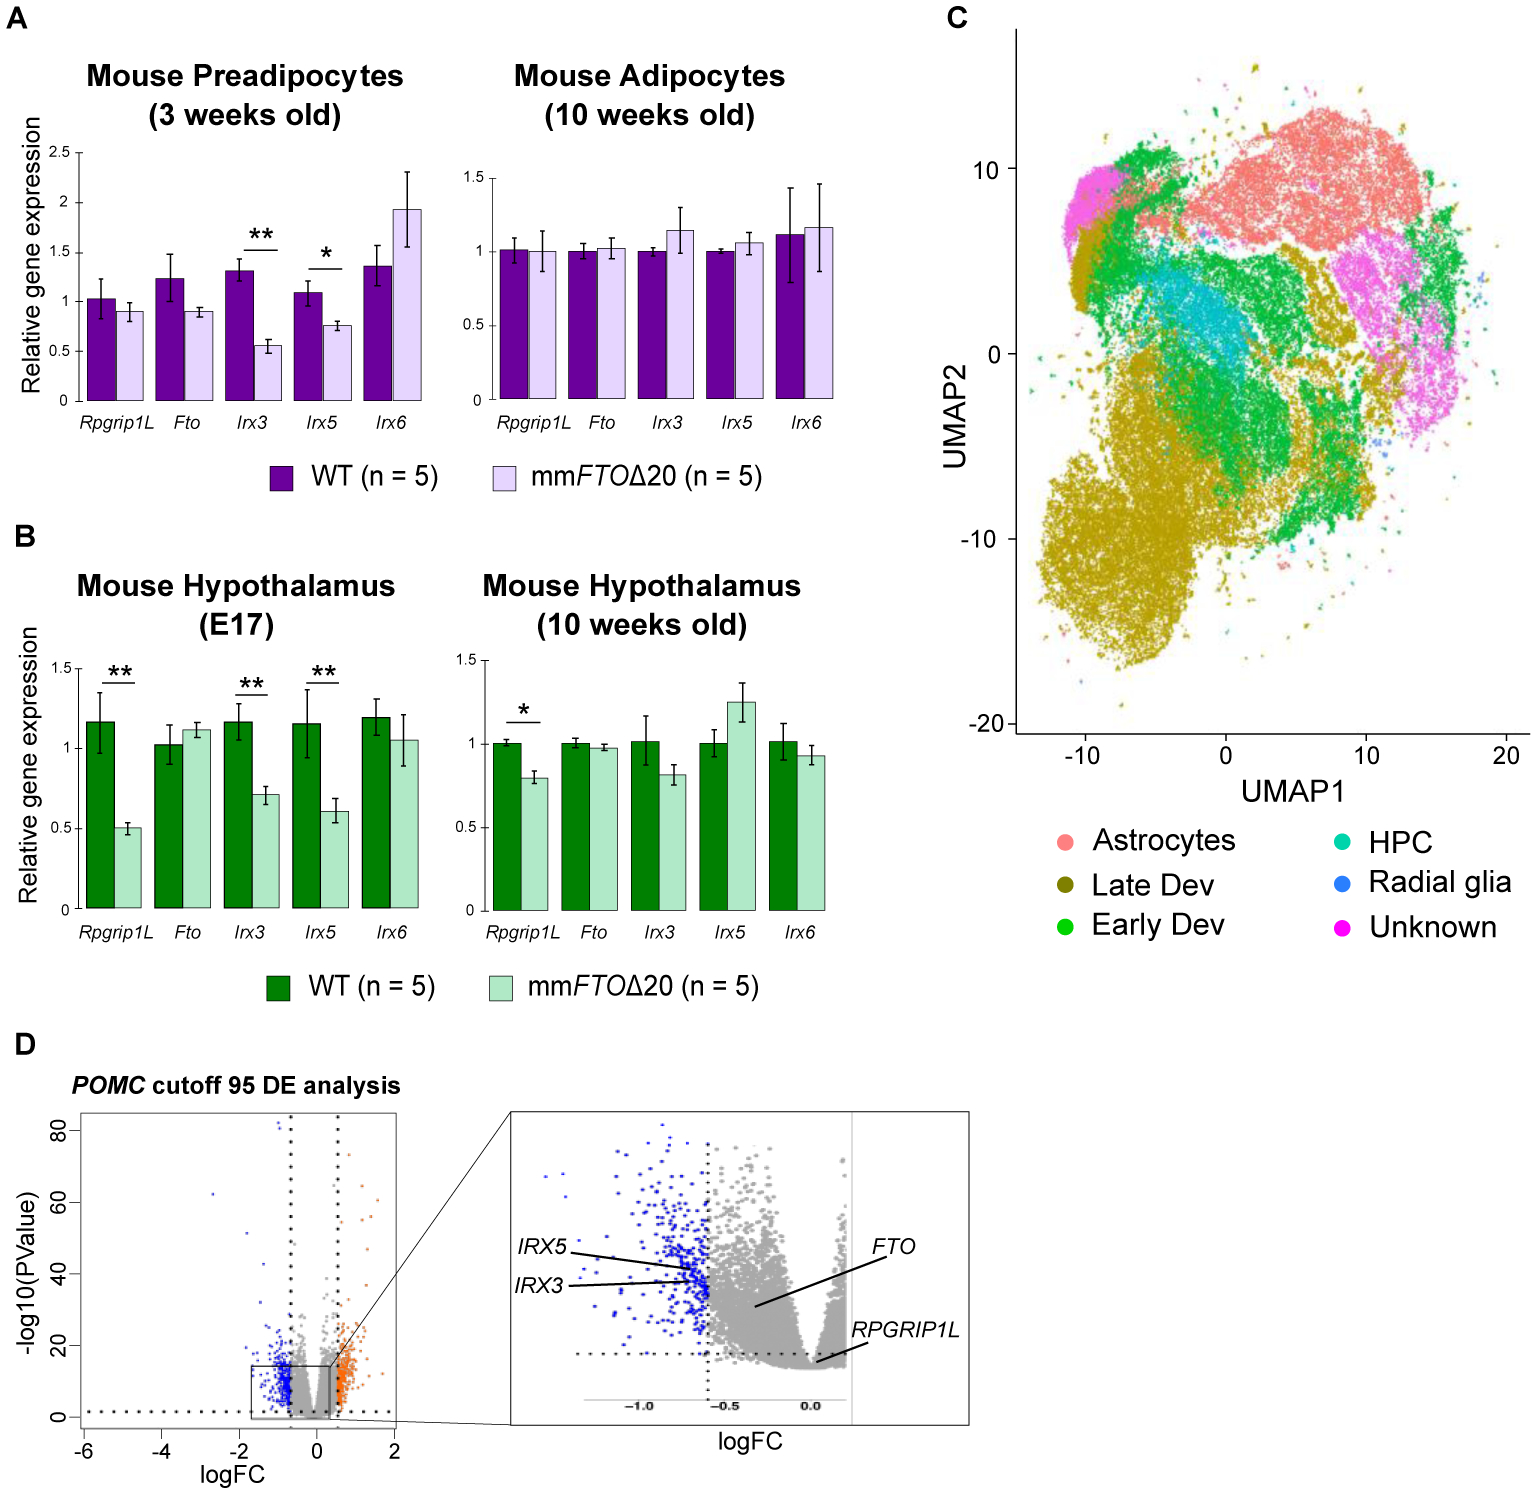
Relative expression of Rpgrip1L, Fto, Irx3, Ixr5, and Irx6 genes in (A) mouse preadipocyte cells, adipose tissue, and (B) hypothalamus. (C) UMAP plot showing the different cell populations identified using single cell sequencing. (D) Volcano plot of the differential gene expression (DE) analysis between WT and hsFTOΔ36 hypothalamic precursor cells with POMC cutoff 95 (counts) and KNN K=11. Gray dots represent genes not significantly changed. Blue and orange dots are genes significantly down and up-regulated, respectively. The log fold change (logFC) is shown on the x axis and the negative log10 of the adjusted P value is shown on the y axis (logFC cutoff > 0.6 or < −0.6, and adjusted P value < 0.05 as significantly differentially expressed). IRX3 and IRX5 are significantly differentially expressed across two conditions with KNN K ranging from 10 to 13 (IRX3), from 11 to 13 (IRX5), and cutoff value above 80 or 85 (counts). The abbreviations are: HPC (hypothalamic progenitor cells); Early Dev (hypothalamic neurons at early development time point); Late Dev (hypothalamic neurons at late development time point). For qPCR analysis data are expressed as mean ± SEM. *P < 0.05 and **P < 0.01 compared to WT.