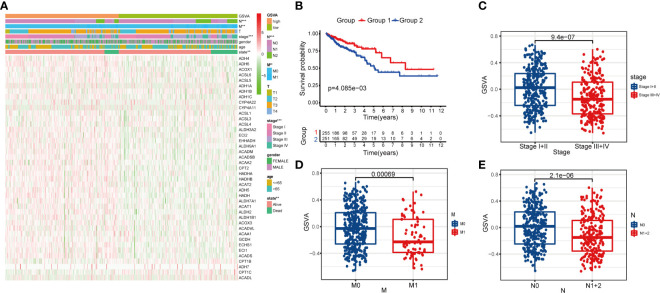
Figure 2.
Clinical correlation of fatty acid metabolism pathway in patients with CRC. (A) The heatmap showing the associations between the GSVA enrichment score of fatty metabolism pathway and CRC-related clinical characteristics in the dataset from TCGA. **p < 0.01; ***p < 0.001. (B) Kaplan–Meier curves of OS in TCGA-CRC patients based on the GSVA enrichment score. (C–E) boxplots comparing the GSVA enrichment scores in different tumor stages, M stages, and N stages of TCGA-CRC patients.

