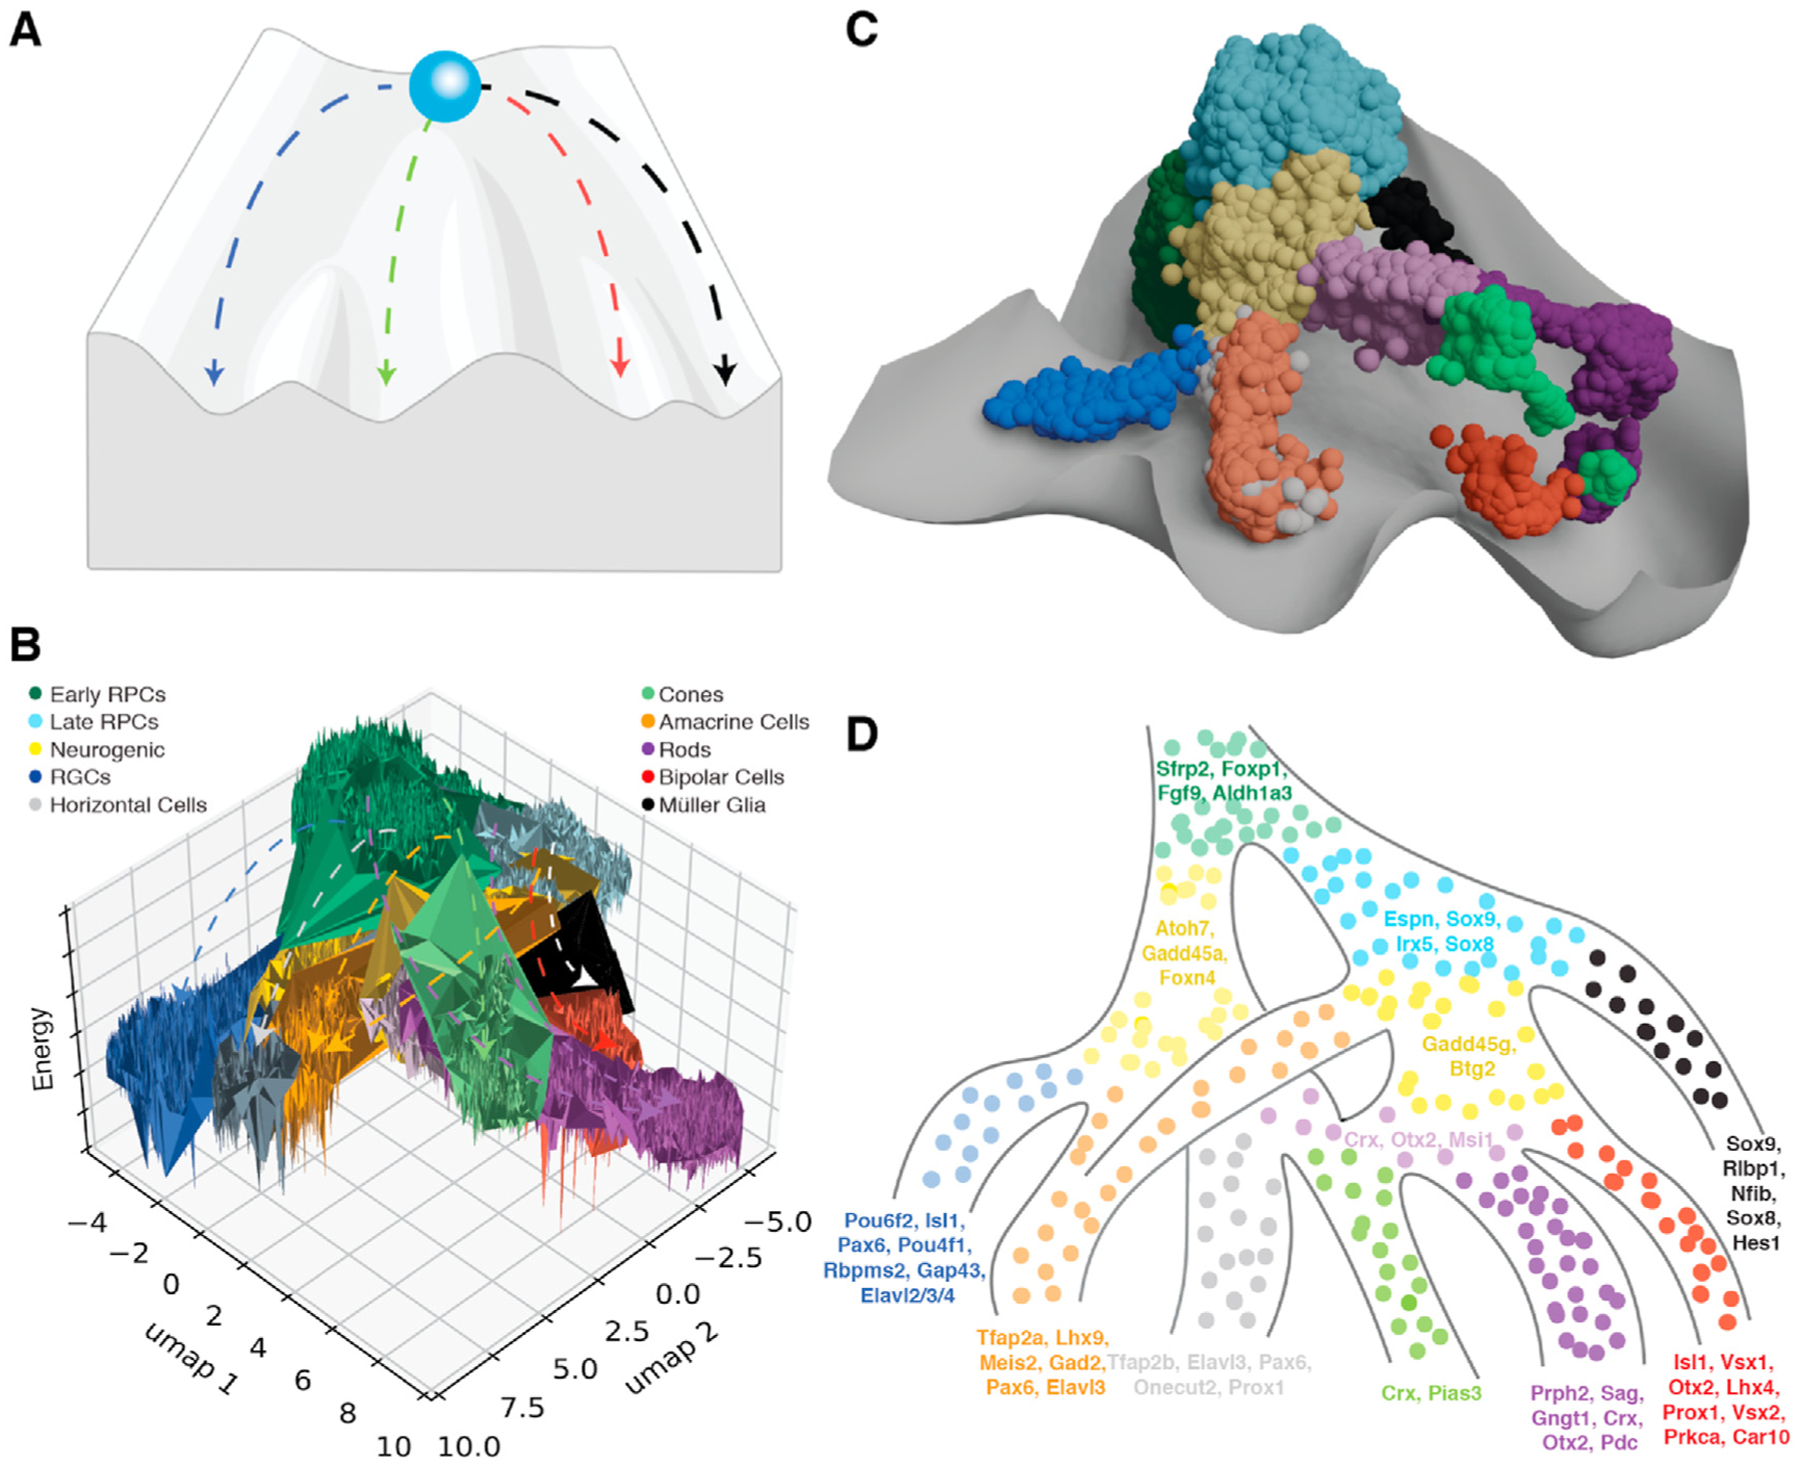
Fig. 3. Waddington landscape of the developing mouse retina from scRNA-seq.

A) Representative Waddington landscape, where a ball - multipotent progenitor -is at the top of a hill. As the ball rolls down the hill - through developmental time -, the peaks and valleys influence where the ball will travel. Ultimately, when the ball reaches the bottom, it is committed to one path, representing a terminal cell fate decision (Waddington, 1957); Waddington landscape generated with Biorender.com. B) Representative potential energy landscape (Soto et al., 2020) as calculated from scRNA-seq results of the developing mouse retina (Clark et al., 2019). Dotted lines represent major cell type trajectories - analogous to valleys within the Waddington model - from early and late RPCs within the developing mouse retina. C) Retinal development waddington landscape derived from mouse single-cell RNA seq data. D) Model of mouse retinal development based on Waddington landscapes. Listed gene transcripts display dynamic RNA velocities - as identified through scVelo (Bergen et al., 2020) — across cellular trajectories for each annotated cell type. Color annotations for B-D are listed in panel B.
