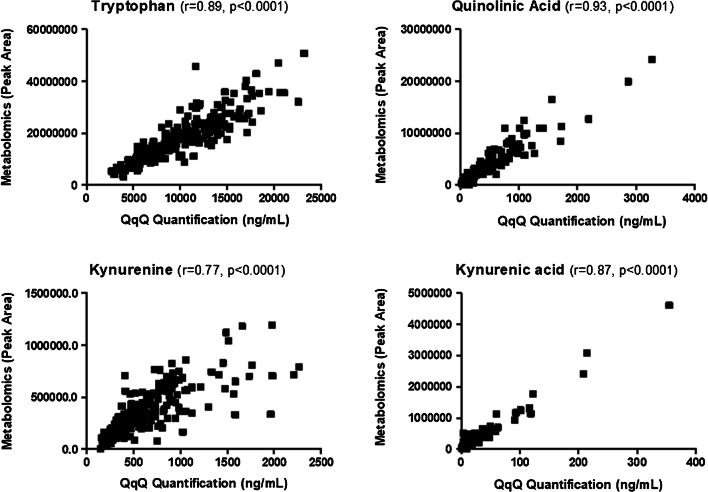
Fig. 4.
Comparison of metabolite concentrations measured by using untargeted and targeted approaches. Correlation between LC-HRMS data (peak area, exactive instrument) and absolute quantification data (ng/mL, Waters Xevo TQ-XS instrument) obtained for tryptophan, quinolinic acid, kynurenine, and kynurenic acid measured in the serum of 217 patients with different levels of cirrhosis decompensation. Correlation analyses were achieved by calculating Pearson correlation coefficients (r). Experimental conditions are displayed in the publication of Claria et al. [130]

