
FIGURE 7.
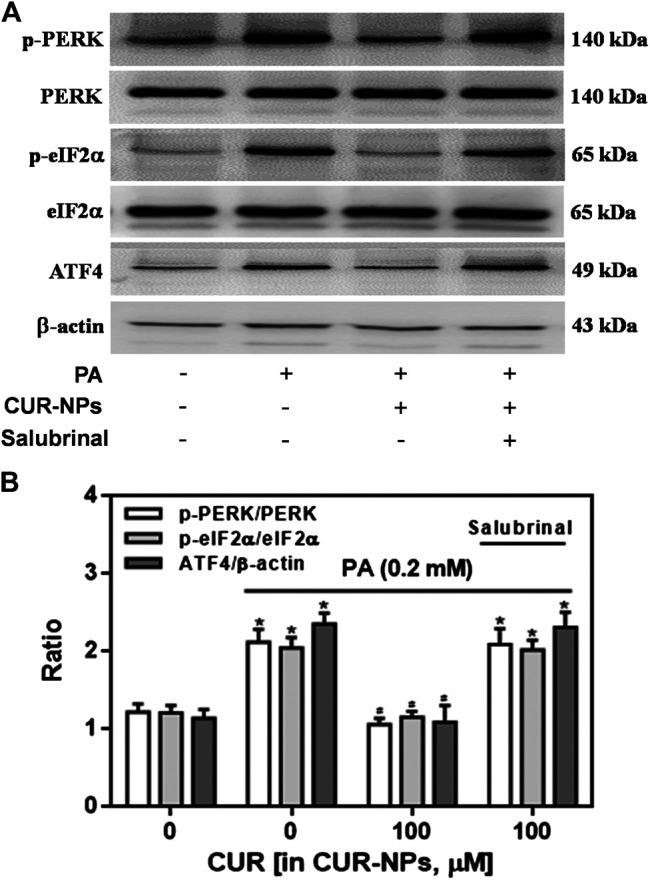
Effects of CUR-NPs on the expression of PERK/eIF2α/ATF4 pathway-related proteins in cardiomyocytes exposed to PA (A) Representative images of p-PERK, PERK, p-eIF2α, eIF2α, ATF4 and β-actin expression by western blot (B) Quantitative analysis of the p-PERK/PERK, p-eIF2α/eIF2α and ATF4/β-actin. Salubrinal: 30 μM *p < 0.05 vs control group; # p < 0.05 vs PA group; $ p < 0.05 vs PA + CUR group.