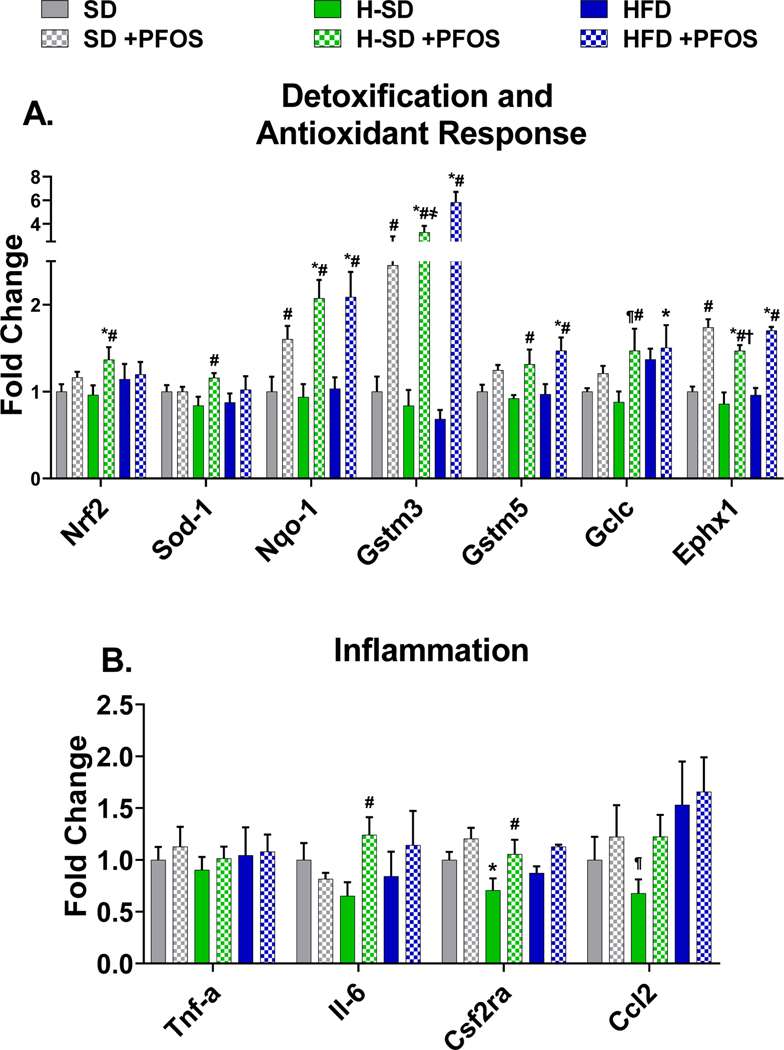
Figure 5. Hepatic lipid oxidative stress gene expression.
The quantification of selected liver mRNAs was performed using QuantiGene 2.0 Plex Assay kit with purified RNA. The fluorescence intensity (FI; minus background) for each gene was normalized to the housekeeping gene β-actin. Fold change was calculated between the control SD mice. A) PFOS treatment induces expression of genes related to detoxification and antioxidant response. B) Only in the H-SD diet, PFOS induces expression of interleukin 6 (Il-6) and colony stimulating factor 2 receptor α (Csf2ra). Calculations were done using a one-way ANOVA followed by Fisher’s LSD test. All values are means ± SEM; N = 5. * indicates p<0.05 versus control SD, ¶ indicates p<0.05 for H-SD versus HFD, # indicates p<0.05 versus respective diet controls, † indicates p<0.05 for H-SD+PFOS versus SD+PFOS, and ҂ indicates p<0.05 for H-SD+PFOS versus HFD+PFOS.

