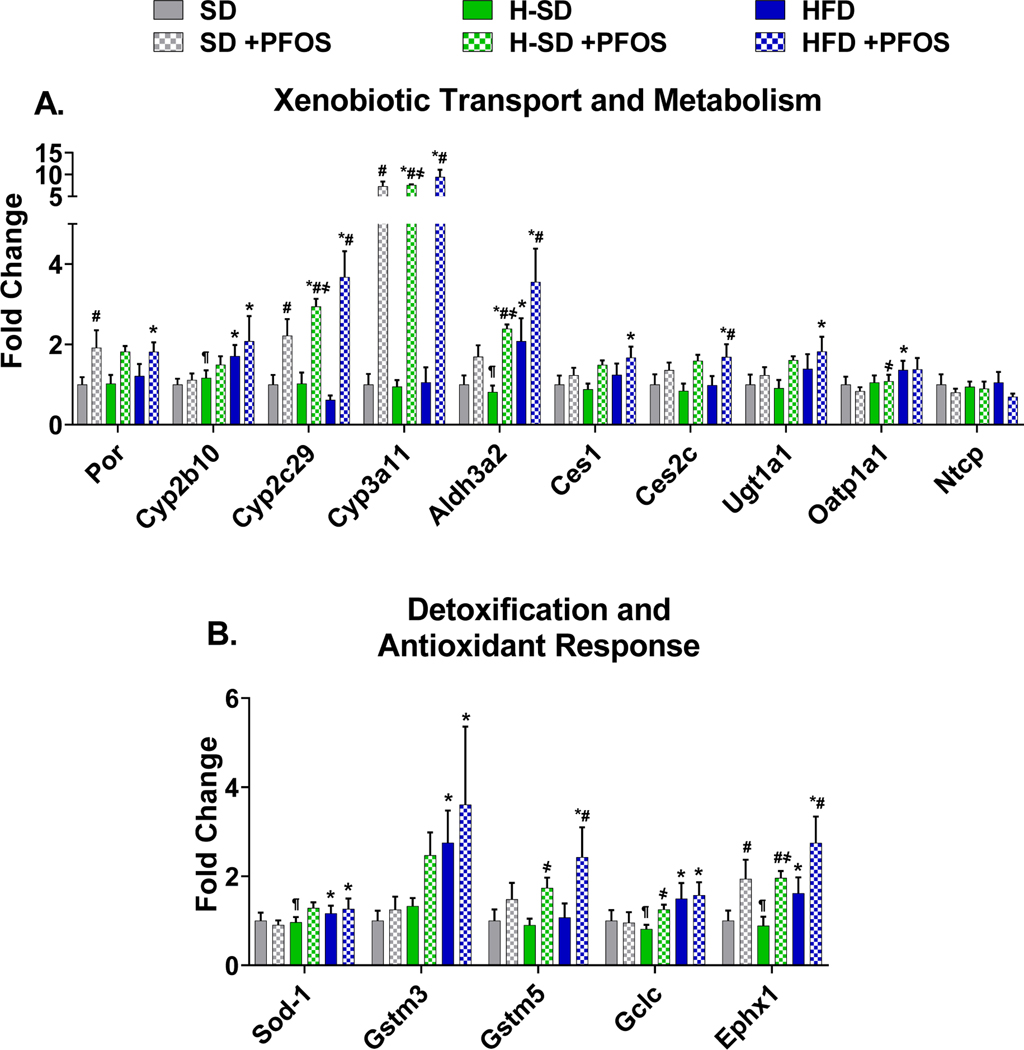
Figure 8. Targeted proteomic analysis of xenobiotic metabolism and transport and oxidative stress genes.
Peaks for specific protein targets were analyzed using Skyline open source software. Areas for each fragment ion was summed for each peptide and one or two peptides were averaged for each protein. Areas were normalized to a technical standard for digestion and final concentrations of digested proteins. Fold change was calculated between the control SD. A) PFOS treatment induced genes related to xenobiotic metabolism. B) PFOS treatment induces expression of genes related to detoxification and antioxidant response. Calculations were done using a one-way ANOVA followed by Fisher’s LSD test. All values are means ± SEM; N = 4. * indicates p<0.05 versus control SD, ¶ indicates p<0.05 for H-SD versus HFD, # indicates p<0.05 versus respective diet controls, † indicates p<0.05 for H-SD+PFOS versus SD+PFOS, and ҂indicates p<0.05 for H-SD+PFOS versus HFD+PFOS.

