FIGURE 1.
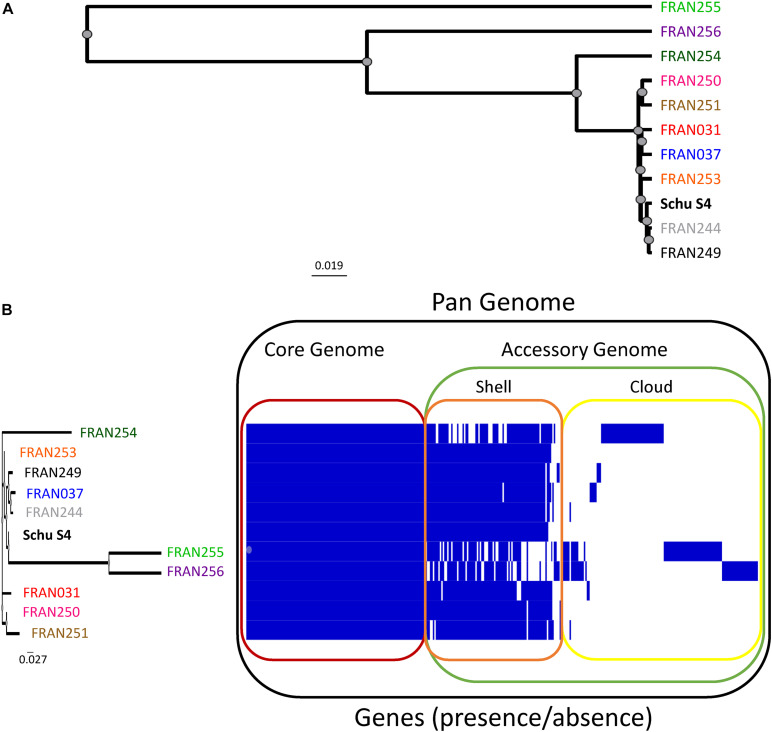
Genomic diversity and pan-genome analysis of the selected F. tularensis panel. (A) A distance tree was generated based upon the average nucleotide identity calculated for the entire genomes of our 10 strain panel and the original Schu S4 sequence (Larsson et al., 2005). The tree indicates clustering of sample matrix by unweighted pair-group method with arithmetic mean (UPGMA). (B) Presence/absence of all genes were assessed across the 11 genomes using Roary, and results were visualized using Phandango. Blue bars indicate the presence or absence of a specific gene across the panel, with genes shared across all strains outlined in red (core genome), genes conserved among most strains outlined in orange (shell), and poorly conserved genes outlined in yellow (cloud). The shell and cloud genes make up the accessory genome (green). The dendrogram based upon the accessory genome of strains in this panel is shown to the left. F. tularensis panel strains are color-coded here and in subsequent figures as follows: FRAN249 - black, FRAN244 - gray, FRAN031 - red, FRAN037 - blue, FRAN255 - green, FRAN256 - purple, FRAN250 - pink, FRAN251 - brown, FRAN253 - orange, FRAN254 - dark green.

